Finding a good trading opportunity requires two things. The first is that there needs to be a pricing discrepancy. A difference between the current market price and what you think fair value should be.
The second is that there needs to be an understandable reason why this opportunity exists.
Answering this second question requires developing a really strong understanding of what makes something a “tradable” piece of information. It also requires understanding how to apply the information you are seeing in the market to the implied volatility you are seeing on the option chain.
This article is going to teach you how to interpret information and match it up against the data you are seeing so that you can find solid opportunities.
Key Takeaways:
- Value of Tradable Information:
- Tradable information provides a competitive edge by offering insights not yet reflected in market prices, distinguishing it from widely known, non-tradable information.
- Differentiating Tradable Information:
- Characteristics include its proprietary nature, exploitation of market inefficiencies, and the challenges associated with its effective utilization.
- Using marketing information to explain option mispricings:
- When there is a large spike in implied volatility we need to understand why before we place a trade. If we can’t explain it, then maybe someone knows something that we don’t, and we could find ourselves on the wrong side of the trade.
- Essentials of Good Research:
- Effective research combines quantitative analysis with qualitative insights, employs logical reasoning to understand market anomalies, and filters out trades based on non-tradable data.
What Makes Information Valuable?
To start this discussion on research, we need to define what makes information valuable. Valuable information is what we call tradable information. This differs significantly from non-tradable information, which is often public and widely known. Tradable information provides an edge because it offers insights that are not already priced into the market.
A Cautionary Tale
Let me share a story about a stock I once looked into, called TEUM. TEUM was a technology infrastructure company trading around $2. I saw several positive catalysts on the horizon: new contracts, funding, a new CEO, and unrealized revenues from the previous year rolling into the current quarter. Based on these factors, I predicted the stock would rise significantly in the next six months.
However, the stock remained stagnant and even took a dip when one of the anticipated events fell through. This turned out to be one of my worst trades. What went wrong?
I had confused publicly available information with tradable information. The positive catalysts I identified were already known to the market, meaning the stock was already priced according to these expectations.
Distinguishing Tradable from Non-Tradable Information
Understanding the difference between tradable and non-tradable information is crucial. Here are some characteristics of tradable information:
- Not Well Known: Tradable information is often proprietary or not widely disseminated. For example, you might discover a unique market correlation through your analysis that others haven’t identified.
- Structural Inefficiencies: Certain market conditions create inefficiencies that can be exploited. For example, funds often hedge their positions by buying out-of-the-money puts and selling out-of-the-money calls, leading to pricing inefficiencies that traders can take advantage of.
- Difficult to Use: Even if an edge exists, it may be challenging to exploit. For instance, selling options around earnings events can be profitable, but the associated risks deter many traders.
From Data to Confidence: Understanding Why
Good research goes beyond identifying discrepancies in data; it seeks to understand why these discrepancies exist. This understanding transforms data into actionable insights.
Here is an example of a situation you may commonly find yourself in as an option seller:
Lets walk through an example where we are analyzing a ticker that is showing implied volatility (IV() to be significantly higher than realized volatility (RV):
- Data Insight: IV is at 150%, and the average realized volatility is 75%. The options are priced at $10, but you believe they should be worth $5. You are considering selling them.
- Research Insight: Before acting on this data, investigate why the IV is so high. Maybe the company has recently released some bad news related to product sales and it caused the stock price to drop.
- Combining the Data and Research Insights: Since the news is already released and the market is aware of the poor sales, you think the new stock price after it dropped is fair and reflects this information. For this reason, you think implied volatility should have come back down.
- Decision: Since the implied volatility has stayed elevated and there should be no further news to drive the stock price to experience rapid changes, you decide to proceed with the trade. The options are expensive, you understand why, and you believe they should decrease in value. Nice!
Characteristics of Good Research
- Comprehensive Analysis: Good research covers both quantitative data and qualitative insights. It involves understanding market conditions, upcoming events, and the broader economic environment.
- Logical Reasoning: Combine data with logical reasoning. If IV is high, find out why. Is there insider trading? Is there a significant event on the horizon? This combination provides a more complete picture.
- Filtering Bad Trades: Use your research to filter out trades based on non-tradable information. This step is crucial in refining your strategy and improving your success rate.
Applying Research in Trading
Research is the backbone of a successful trading strategy. By combining data with logical reasoning, you can develop a well-rounded perspective on market conditions and potential trades.
Practical Steps:
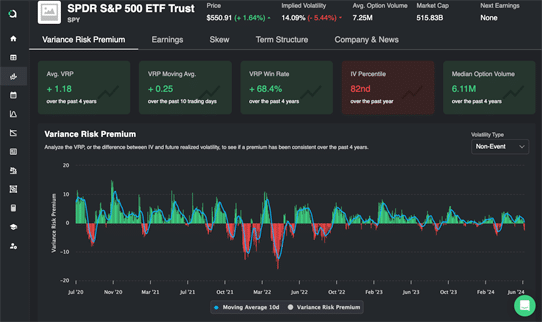
- Data Collection: Start with collecting data on variance risk premium, backtest results, recent changes in volatility, stock prices, and other relevant metrics.
- Analyze Trends: Look for trends and correlations that may indicate pricing inefficiencies.
- Understand the Context: Investigate the reasons behind the data. Why is IV high? Are there upcoming events that justify it? Is there an underlying market trend affecting the prices?
- Validate with Logic: Ensure that your data-driven insights are backed by logical reasoning. This step helps in building confidence in your trades.
How Traders At Predicting Alpha Think About Research
At Predicting Alpha, we emphasize the importance of understanding why you are getting paid and running strategies that actually make money.
We believe that ideas without data can’t be traded. But we also believe data without ideas are worthless too. You need to understand why you are getting paid, and have proof that you actually will get paid.
That’s the foundation of good trading. It’s the quantitative and the qualitative.


