In this blog I’m going to cover the concept of spot and implied volatility (IV) correlation and how it impacts option selling strategies. I will show you the relationship between stock price movements and implied volatility changes, how this correlation varies across different assets, and how you can use this information to structure your trades effectively.
Key Takeaways
- Defining Spot and Implied Volatility Correlation: Spot price is the current price of the underlying stock, while implied volatility represents the relative value of the options being traded on that ticker. The correlation examines how changes in spot price impact IV, which can differ significantly between assets.
- Examples of Correlation:
- S&P 500 (SPY): Generally, when the S&P 500 rises, IV decreases, and when it falls, IV increases.
- Gamestop (GME): Exhibits a positive correlation where both spot price and IV rise and fall together.
- Practical Applications for Traders:
- Implicit views: If you are selling volatility on a ticker with negative spot / volatility correlation, you are implicitly saying you think the share price will rise (if volatility goes down, share price should go up).
- Structuring Trades: Understanding these correlations helps traders position their trades. For example,if you traded Gamestop during the rally, you may have structured a short straddle slightly above at the money so that you have positive returns if the implied volatility drops, while mitigating some risk if the stock continues to rally.
What is Spot and Implied Volatility Correlation?
Defining the Terms
- Spot Price: The current price of an asset, such as the S&P 500, Tesla, or Gamestop.
- Implied Volatility (IV): The market’s forecast of how much a stock will move in the future.
Understanding the Correlation
Spot and IV correlation examines how changes in the spot price impact implied volatility. For instance, if the S&P 500 increases by 1%, what happens to its implied volatility? Conversely, if the S&P 500 decreases by 1%, how does its IV respond?
Analyzing Spot and IV Correlation
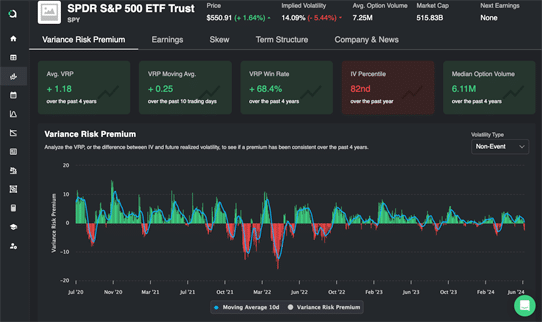
Using the S&P 500 as an Example
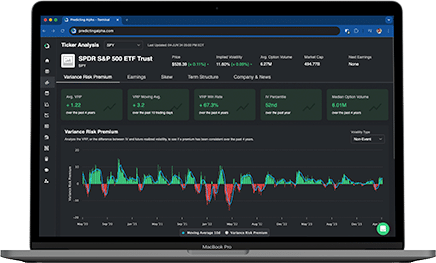
Let’s analyze the S&P 500 (SPY) to understand this correlation better. When the S&P 500 goes up by 2%, implied volatility typically decreases. Conversely, when the S&P 500 drops by 2%, implied volatility tends to rise by approximately 15.6%.
Visualizing the Data

Different Assets, Different Correlations
Gamestop: A Different Picture
Unlike the S&P 500, Gamestop (GME) exhibits a different correlation. When Gamestop’s spot price increases, implied volatility also increases. When Gamestop’s spot price decreases, implied volatility tends to decrease as well.

This makes sense to see on a ticker like Gamestop. Just ask yourself: where is the volatility? If Gamestop was going to see a massive move, is it likely to be to the upside or the downside?
For Gamestop, we have all observed that the answer is to the upside, so it makes sense that we see a positive correlation between spot price and volatility.
Where an analysis like this becomes really valuable is for tickers where the relationship is perhaps not so obvious. A good example of this is Tesla (TSLA) back in 2021-2022. It’s rare for such a large company to exhibit a positive spot volatility correlation, but for a while it’s exactly what we saw with Tesla.
Practical Applications for Traders
Structuring Trades Based on Correlation
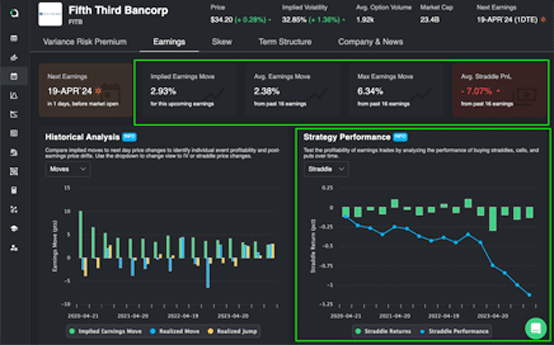
Understanding spot and IV correlation is vital for structuring trades. Let’s consider a scenario using GameStop (GME):
Suppose GME is trading at $43. We anticipate a drop in IV and a decline in the spot price. By selling a straddle with a strike price slightly above the current spot price, we can capitalize on the correlation:
- If GME’s price drops, we benefit from the decrease in IV.
- If GME’s price increases, the impact is mitigated by our initial positioning above the spot price.
Three Things to Remember
Implicit Directional Views
When trading volatility, always consider the implicit directional view. For example, being long on the S&P 500 implicitly means you are short on volatility since the S&P tends to rise when volatility is low.
Adapting to Changing Correlations
Correlations change. The trade that we placed today may not be done the same way next month if the correlation is significantly different.
Utilizing Correlation in Risk Management
By understanding the correlation between spot price and IV, traders can better manage their risk and optimize their strategies. The Gamestop trade is a good example of this.
Conclusion
Spot and volatility correlation is pretty straightforward at the end of the day. But it’s important to understand what your trade means, and what you are implicitly saying by taking certain actions. Remember, trading is about developing your view and expressing it correctly. Understanding spot volatility correlation helps with both of those.