Option selling as a strategy is something that has been around for a long time. The reason we are able to run these strategies is because of the idea that implied volatility tends to overstate realized volatility.
This phenomenon is not something new. It’s not some hidden secret. It’s well researched, throroughly documented, and the entire reason we sell options to begin with.
It’s called the variance risk premium (VRP).
This article is going to prove to you that the VRP exists, will continue to exist and that leveraging it is the key to running a profitable option selling portfolio.
At Predicting Alpha, the strategies we run are all based on monetizing the VRP. They tend to be pretty “boring” strategies because we aren’t doing magic, but they offer real returns backed by data and logic.
This article is going to change the way you think about trading. It’s going to be awesome. So let’s get into it!
Note: need a refresh on how implied volatility works? Click here to read my detailed guide.
Key Points
- Understanding Variance Risk Premium (VRP): The VRP is the difference between implied volatility (market forecast) and realized volatility (actual market movement), found across various asset classes and crucial for profitable trading strategies.
- Why VRP Exists: Factors such as the demand for market protection (insurance), speculative buying (gambling), protection against sudden price jumps, and retail trading limitations ensure the persistent existence of the VRP.
- Calculating and Utilizing VRP: By comparing implied and realized volatility over extended periods, traders can identify and leverage the VRP for consistent returns, forming the foundation of strategies at Predicting Alpha.
- It’s Why We Make Money: 99% of profitable option strategies harness the VRP. At Predicting Alpha we focus on the premium that comes from selling options on ETFs, and the premium that comes from selling options around earnings events.
What is the Variance Risk Premium (VRP)?
The variance risk premium is the tendency for implied volatility to be higher than the subsequently realized volatility. This phenomenon is observed across various asset classes, including equity indices, the VIX, bonds, commodities, currencies, and many individual stocks.
The VRP is measured as the difference between implied volatility (the market’s forecast of future volatility) and the actual volatility that materializes over time. Most strategies that we trade are based on trying to monetize this risk premium. It’s similar to how the key behind all stock buying strategies is the equity risk premium.
In plain English, the variance risk premium (VRP) refers to the fact that option prices are typically higher than the actual volatility experienced. This means options are usually expensive.
Why is VRP Important?
The significance of VRP is that it justifies selling options as a profitable strategy. Without this phenomenon, there would be no inherent reason to believe that selling options would continue to be profitable in the future.
Fortunately, the VRP does exist and is likely to persist. Let’s delve into the reasons why.
Data Proving The Variance Risk Premium Exists
Let’s look at some hard numbers to illustrate that the variance risk premium (VRP) indeed exists. The S&P 500 provides a good example.
The graph below shows the difference between implied volatility and realized volatility for the S&P 500, often used to represent the broader market. This graph demonstrates the presence of the VRP.
- Blue Line: Represents the implied volatility.
- Orange Line: Represents the realized volatility.
The graph reveals that, on average, the implied volatility is 4 points higher than the realized volatility. Notably, the variance risk premium is positive 85% of the time. This means that in the vast majority of instances, the implied volatility exceeds the realized volatility.
Furthermore, the graph shows that the VRP has persisted for decades, and for reasons we will discuss below, the VRP is likely to continue into the future. This provides a strong basis for the profitability of options selling strategies.
Does The VRP Exist Across Indexes?
The same analysis has been conducted for the Dow Jones, NASDAQ 100, and Russell 2000. The table below summarizes the key statistical findings:
As you can see, the concept of a variance risk premium (VRP) is evident across all these major indexes. This consistency highlights why selling options can be a profitable strategy.
The VRP phenomenon has persisted for decades and forms the backbone of profitable option trading. Billions of dollars have been raised and traded based on this core idea, and your new strategies will be built upon this foundation as well.
Four Reasons The Variance Risk Premium (VRP) Exists
While data shows the historical presence of the VRP, we need to understand the underlying reasons to confidently believe it will continue. Here are four key reasons for the existence of the VRP:
- Traders are Willing to Pay for Insurance
- The most compelling reason for the VRP is that investors are willing to pay for protection. During market crashes, diversification strategies often fail, and puts become the only reliable form of protection. Consequently, a significant portion of the VRP is driven by the demand for put options.
- Traders are Willing to Pay to Gamble
- Call options can be mispriced due to fear of missing out (FOMO) on significant price jumps. Traders seeking exponential returns are less sensitive to the price of the call options they buy. For example, a retail trader might think, “If the stock is going to jump 1,000%, who cares if the call option costs $5 or $10!”
- Options Protect Against Sudden Price Jumps
- Underlying asset prices can experience sudden jumps, and options provide a way to protect against these jumps. Unlike dynamic hedging strategies, options offer a straightforward way to manage sudden price movements, making them attractive to both hedgers and speculators.
- Most Traders Can Only Buy, Not Sell Options
- Many retail traders face restrictions from their brokers, such as being prohibited from selling naked options. This limitation means that a large group of speculators can only buy options, not sell them, which drives up the variance premium.
Typically, one solid reason is enough to understand the existence of a premium. In this case, we have four compelling reasons. Each of these factors individually justifies the VRP, and it is unlikely that all these factors will disappear simultaneously, regardless of how market dynamics evolve over time. This gives us confidence that the risk premium will continue to be present on average in the future.
Calculating the Variance Risk Premium
The strategies we run are fundamentally designed to capture the variance risk premium (VRP). The rationale behind our trades, the tools we utilize—everything revolves around this concept. Understanding the calculation of VRP is essential, even though our platform handles the analytics for you. Its the backbone of the the backtests, scanners, and metrics we rely on for making good decisions.
Step 1: Compare Implied Volatility with Realized Volatility
To create a data point for our VRP model, we compare the market implied volatility for a period against the realized volatility experienced in that same period. We use the 30 day implied volatility (IV30d) and the subsequent realized volatility over the next 30 days (futureRV30d) to determine the variance risk premium embedded on a given day.
Step 2: Create Data Points Over the Last 4 Years
One day’s data isn’t enough to make a trade. A single day shows if there was a profitable trade, but it doesn’t tell us if there is an embedded premium for us to monetize. To determine this, we run this calculation for every day over a large period (4 years) and build a chart of the variance risk premium.
Remember the analysis that we did for the S&P 500 at the start of this section?
This tool basically allows us to do that analysis for any ticker in seconds. We can immediately see if the variance risk premium exists on an ETF or stock.
How To Interpret The Variance Risk Premium Metrics
Once we have created this analysis, we extract 5 key metrics which help paint a clear picture of the premium landscape for an underlying.
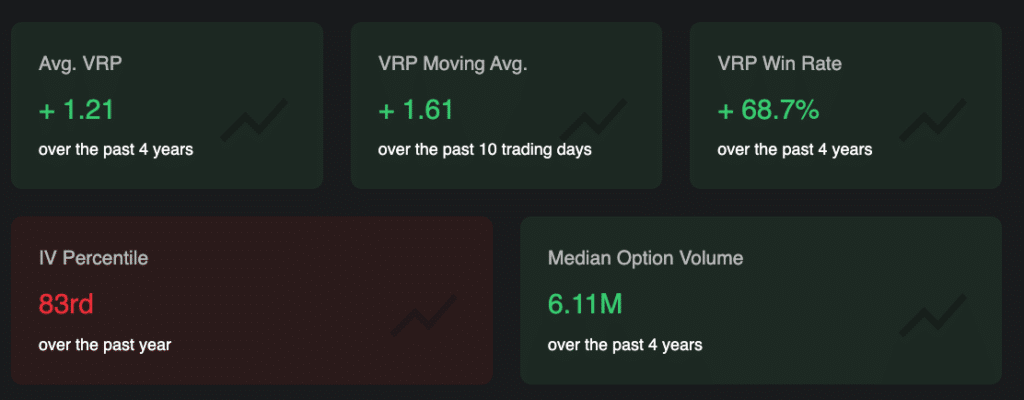
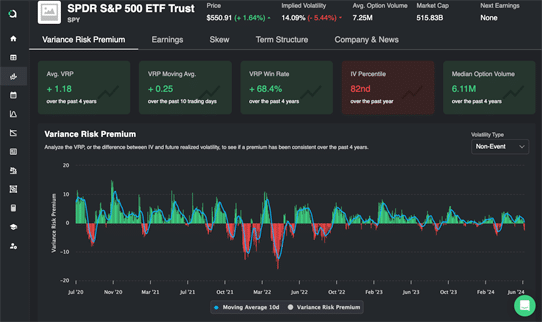
The above picture shows you the key metrics for the variance risk premium of SPY on July 25, 2024.
Let’s break down what each of these metrics mean, and how you would go about interpreting them when you are trying to understand if there is a tradable risk premium for a ticker.
| Metric | Definition | Interpretation |
| Avg. VRP | The average spread between implied volatility (30 day) and the subsequent realized volatility. Uses 4 years of data. | We want to be trading tickers that have an established variance risk premium. Seeing a positive average VRP confirms that our hypotheses that a VRP exists for a ticker is true and that selling options is likes to remain profitable. This is the most important metric in our analysis. |
| VRP Moving Avg. | Same calculation as “Avg. VRP but using only the last 10 days of data. | Since there is short term clustering in volatility, this number helps us see if there has been a risk premium in recent times. It compliments the Average VRP metric to help you make decisions around if there is a premium selling opportunity. |
| VRP Win Rate | The percentage of days over the last 4 years that the VRP calculation output was positive. | We want to be selling premiums that follow the typical risk profile that a short volatility strategy should see (many small winners, occasional big losers). An easy way to observe this is via the win rate. |
| IV Percentile | Current percentile of 30 day implied volatility compared to the past year. | The actual IV Percentile doesn’t impact the presence of the variance risk premium. It always exists. What it does impact is the variance you experience in your PnL. When the IV Percentile climbs above 80, it’s a sign that we will see big swings and therefore may opt to trade a different ticker. |
| Median Option Volume | Represents the average number of options traded each day over the past 4 years. | Since we are making data driven decisions, the quality of the data directly impacts our insights. In order to ensure that our insights are accurate, we want to know if the market has been liquid on average for the ticker we are analyzing. Option volume higher than 5,000 is typically what I would look for in order to have confidence that there has been enough liquidity in the past for the data I am observing to be true. |
Conclusion
Using these tools and with this newfound understanding that we have of why option sellers make money, we are able to go out into the market and uncover strategies and ideas that can lead to us making positive returns.
This analysis the basis for the ETF Premium Strategy that we have made available to our members. The core of this analysis is that it helps us understand if the ticker we are looking at has a premium that we can monetize. We then expand on this analysis and look at backtests to see if we have been able to monetize the premium in a practical way. This is not really the most exciting way to trade. As we often say, you probably won’t brag to your friends about this approach to trading. But in reality, it’s how you make money. So if that’s your goal, click here to see if there are any membership spots available (we are only accepting 1,000 traders).


