Autocorrelation is one of the characteristics of volatility that help us understand how it moves and changes over time. If you’re new to the term, don’t worry—we’ll break it down and explain how it can significantly impact the way you think about option selling. By the end of this post, you’ll understand what autocorrelation is and how to use it to your advantage when trading options, especially as an option seller.
Key Takeaways
- Strategy Implications: Option sellers benefit from negative autocorrelation, ideal for option selling strategies. Positive autocorrelation suggests trends, posing risks for short options strategies.
- Autocorrelation Defined: Measures the relationship between a variable’s current value and its past values, helping identify trends and patterns in stock movements.
- Positive and Negative Autocorrelation: Positive indicates trending markets, while negative indicates mean-reverting markets. Understanding this helps choose appropriate options strategies.
What is Autocorrelation?
Autocorrelation is a statistical concept that measures the relationship between a variable’s current value and its past values. In simpler terms, it tells us how today’s return is a predictor of tomorrow’s return. This concept can be particularly useful in financial markets, where it helps traders identify trends and patterns.
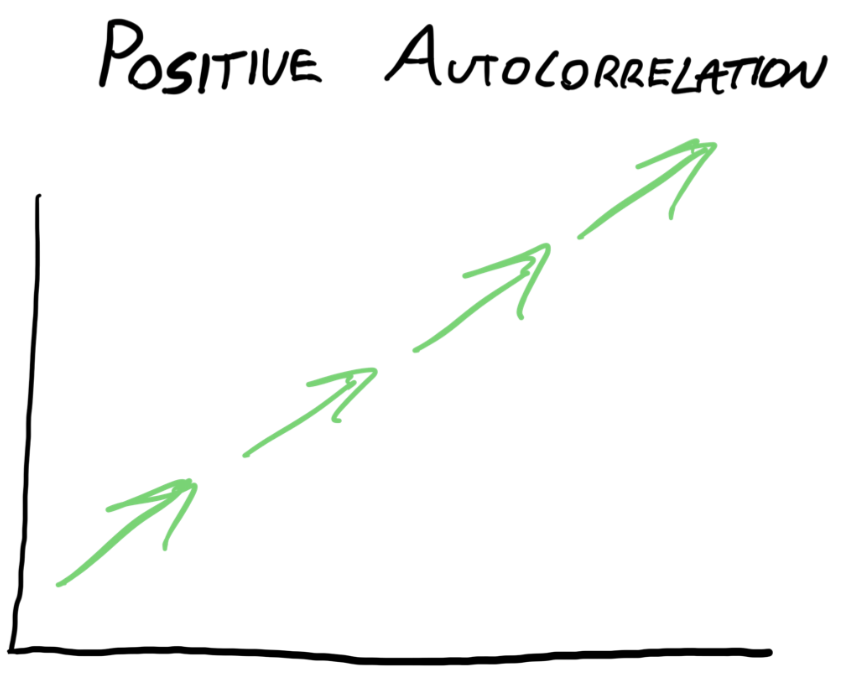
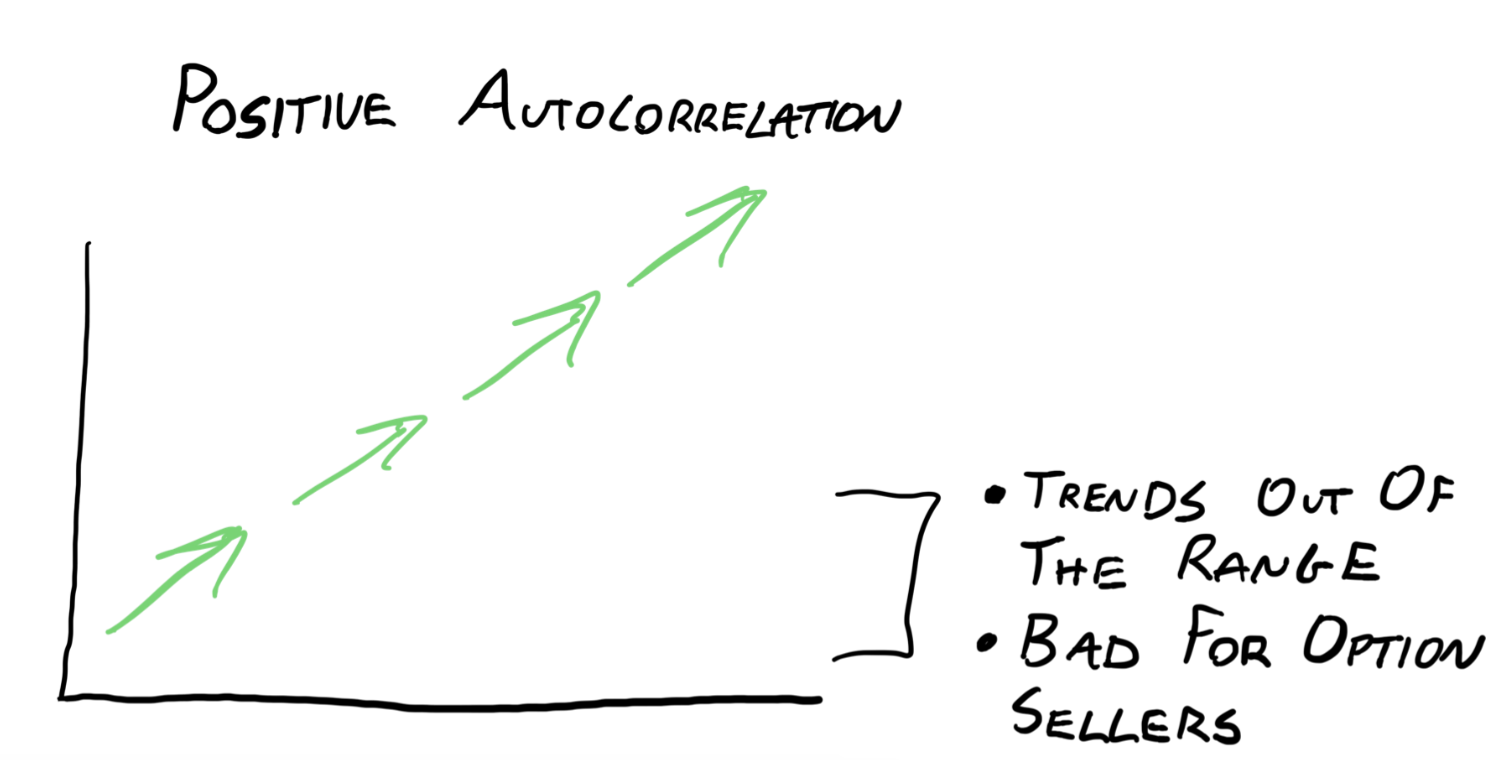
Positive Autocorrelation
Positive autocorrelation occurs in trending markets. A simple way to think of it is that if a stock has positive autocorrelation, a 1% up move today means it’s likely to move up by a similar amount tomorrow. This pattern can continue over multiple periods, indicating a trend. For instance, if a stock is on an upward trend, positive autocorrelation would suggest that it will likely continue moving up.
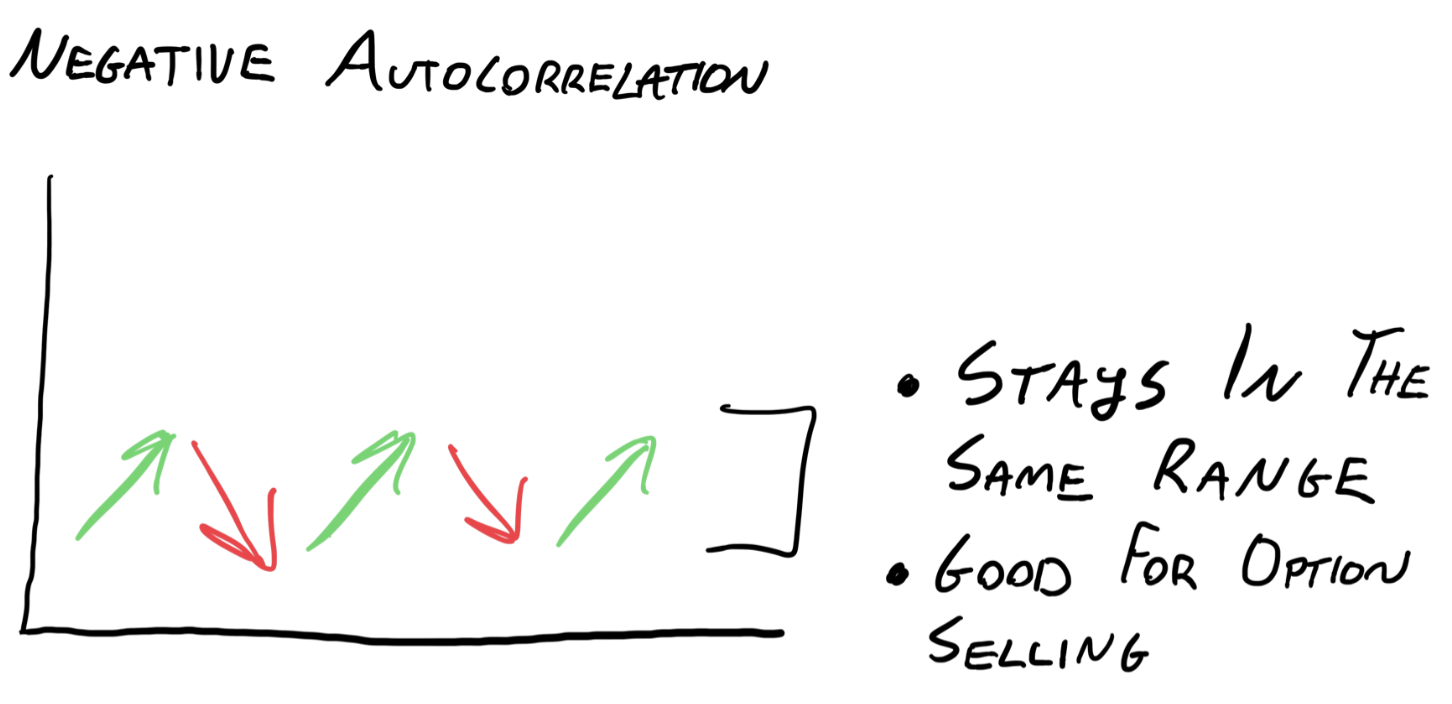
Negative Autocorrelation
Negative autocorrelation is the opposite, and is a characteristic of mean-reverting markets. In this scenario, if a stock goes up by 1% today, it is likely to go down by 1% tomorrow. This back-and-forth movement indicates that the stock price tends to revert to its mean rather than continuing in one direction.

How to Use Autocorrelation in Options Selling
As you can probably imagine, negative autocorrelation is a good thing for option sellers. We want the underlying stock to stay within the break-even of our short straddles or short strangles.
We also want to minimize the frequency with which we need to delta hedge since this leads us to incurring costs.
As an option seller, you benefit from stable or mean-reverting markets. When a stock exhibits negative autocorrelation, it tends to chop around rather than trending in one direction. This is ideal for selling options where we realize profits if the stock price stays within a certain range.
For example, consider a stock that starts at $100 and has negative autocorrelation. If it moves up to $101 today, it is likely to move down to $100 tomorrow, and then up again the next day. This back-and-forth movement means the stock stays within a predictable range, allowing your short volatility trades to profit.
Buying Volatility (Or At Least Avoiding Selling Volatility)
If a stock exhibits positive autocorrelation, it tends to trend in one direction. While this may not strongly indicate an option buying opportunity (the variance risk premium still exists), it can be an indicator that we may want to avoid including this ticker in our portfolio if we believe the positive autocorrelation is likely to continue.
If you are looking to add some long volatility positions to your portfolio, positive autocorrelation may be something you look for when making your decision about where to add these long volatility opportunities.
Conclusion
Now that you know what autocorrelation is, you are going to start seeing it in the behavior of stock price and volatility.
As you continue to learn more about the characteristics of volatility and prices, you will continue to refine the lens through which you view the market.
Key Takeaways:
- Autocorrelation measures the relationship between a variable’s current value and its past values.
- Positive autocorrelation is characteristic of trending markets.
- Negative autocorrelation is characteristic of mean-reverting markets.
- Option sellers benefit from negative autocorrelation as it indicates stability and mean reversion.
Identifying autocorrelation in stocks involves historical price analysis, statistical tools, and understanding market conditions.