The entire game of trading options is about pricing the variance risk premium that is embedded into the option price. If you are able to identify areas where the options are trading at a different price than what they should be, you have found a good trading opportunity.
Most of the time, forecasting option prices isn’t the ideal way to go. We just want to be doing well research things like the ETF Premium Strategy and the Earnings Premium Strategy.
But once in a while when a unique trading opportunity comes around (think meme stocks, short squeezes, etc), we know that option prices aren’t necessarily trading where they should be due to irrationality and it’s in these situations that having some more sophisticated pricing techniques can be extremely beneficial.
In this article we are going to talk about the two ways you can and should price an option in these situations. These are techniques that I learned from years of trading alongside professionals. It’s resulted in finding some of the best trading opportunities that have made my year(s) and now you’ll have the skills to do the same.
When it comes to pricing options and valuing volatility, there are two ways we can do it. We can compare the implied volatility of an option to where it has been trading in the past, or we can compare it to the implied volatility of similar options in the market.
Key Takeaways
- Absolute Valuation: Involves comparing an option’s current implied volatility (IV) to its historical volatility. We know that volatility is mean reverting, so by benchmarking against historical averages we can estimate the fair value of future volatility.
- Relative Valuation: Compares the IV of one stock to similar stocks within the same sector. If we know that two companies share similar volatility profiles, seeing divergences in their implied volatility (or if we go a level deeper, the risk premiums on each of them), then we can use this information to understand if volatility is mispriced for our target ticker.
- Practical Applications: A huge trade we placed on Discovery Communications (DISCA) involved comparing its IV to Fox Corporation (FOXA) and capitalizing on the discrepancy. This type of analysis can be applied in many different scenarios.
Understanding the Basics
The Value Investing Analogy
Just as value investors seek stocks with low price-to-earnings or price-to-book ratios, option traders look for volatility mispricings. We aim to buy options when volatility is low (cheap) and sell when volatility is high (expensive). However, determining what constitutes “cheap” or “expensive” volatility is not so simple as saying volatility is “low” or “high”. We are going to need a way to actually estimate the fair value of volatility to benchmark what we are seeing in the market against.
Absolute vs. Relative Valuation
No matetr what product you trade, you want to understand the techniques that can be used to help you price the fair value of the asset you are trading. In the world of stocks, we will often see people pricing the stock price based on the value of the company itself. This is because fundamentally the stock price of a company reflects the value of the company itself. In the world of options, we have to follow a similar mentality but instead of looking at the intrinsic value of the underlying company we need to price the implied volatility for it.
Most option sellers take an overly simplistic approach to this. They will simply look at the IV for an option and see if it’s higher or lower than where it’s been in the past. But this doesn’t really work because it doesn’t tell us where the option price should be. So what do we do?
There are two key approaches that can be taken to price an option’s fair value. By using them together you are able to get a clear picture of what price an option should be trading at. These methods are:
- Absolute Valuation: Assessing an option’s value based on its own historical volatility data.
- Relative Valuation: Comparing an option’s volatility to that of similar assets.
Let’s break down each method and how they apply to options trading.
Absolute Valuation of Volatility
Historical Volatility Analysis
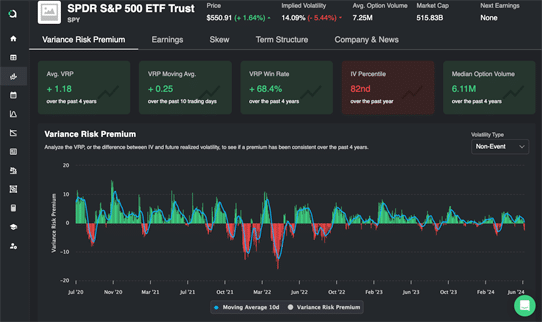
One way to gauge if an option is cheap or expensive is to compare its current variance risk premium to its historical variance risk premium. For instance, if a stock’s (IV-subsequentRV) is currently at 8 points, and historically it hovers around 5 points, the current VRP may be greater than it is on average, indicating that the option premiums are richer than usual.
A similar comparison can be done with the IV/RV ratio for the ticker, which aims to show how great the spread between implied and realized volatility is today relative to the past. What you will notice is that this ratio is stationary & mean reverting.
You can benchmark it against its average and make trading decisions accordingly.
As you can see, what we have done in both of these cases is make a transformation to the typical “historical IV” numbers that traders look at to help us have a reference point for where it should be trading. We know that there should be a variance risk premium embedded into the options. The absolute valuations are based on establishing where that VRP should be, and if the current VRP is higher than that.
Relative Valuation of Volatility
Comparative Analysis
In addition to absolute valuation, we can also do what’s called a relative valuation. As the name implies, we can say that similar companies should have similar implied volatilities. If they move similarly, then they should be priced similarly in terms of how much future volatility we should expect to see.
If we can identify companies that are correlated with each other, we can use this to our advantage. We can compare the IV of similar stocks to see where the fair value price should be. For example, let’s look at Coca-Cola and Pepsi. These companies share similar market caps, industries, and underlying fundamentals, so their volatilities should be comparable.
By plotting the IV/RV ratios for your target company and a comparable company, you are able to see the relationship between the two. Assuming there is a clear relationship historically, any break in the relationship that is visible now can inform us about the richness of the premium for the ticker we are looking to trade.
For example, if normally the IV/RV ratios are pretty tight together, but then right now the ratio for our target company is much higher than it is for the comparison company, you can determine that volatility is expensive for your target ticker relative to the comparison company’s volatility.
Example: Coca-Cola vs. Pepsi
If Coca-Cola’s IV is 20% and Pepsi’s is 60%, there’s likely a mispricing. We can exploit this by buying Coca-Cola options (low IV) and selling Pepsi options (high IV), expecting the volatilities to converge.
Real-World Application – The Discovery Example
A couple years ago when the Archegos fund imploded, a great trading opportunity on DISCA appeared because a large amount of forced selling pressure cam into the market. We knew that there was likely a trade on DISCA, but in order to allocate meaningful capital, we needed to figure out a way to price where DISCA options should be trading (fair value). As a part of this analysis, we conducted a relative value pricing. We first ran a correlation analysis to find similar companies, such as FOXA (used in our analysis). By analyzing DISCA’s IV and comparing it to similar companies like Fox Corporation (FOXA), we identified a substantial mispricing.
Step-by-Step Analysis
- Initial Screening: Using our terminal, we scanned for stocks with high IV rank and IV vs. forecast.
- Correlation Check: Ensured that DISCA and FOXA were correlated (80% correlation over the past year).
- Relative Valuation: Compared DISCA’s IV to FOXA’s. Typically, DISCA trades at 1.2 times FOXA’s IV. With FOXA at 48% IV, DISCA should be around 58%, but it was at 83%—a clear overpricing.
- Action Taken: Based on this analysis, we sold DISCA options expecting the IV to drop.
Outcome
The IV for DISCA dropped as predicted, leading to substantial profits.
Implementing the Strategy
Here are the practical steps that you would take to implement this approach to pricing volatility using absolute and relative methods:
- Estimate Your Expected Return: Swap out the implied volatility in an option price calculator for the option with your forecast of future volatility to estimate how much you should expect to return by taking the trade.
- Screen for Opportunities: Use tools to find stocks with unusual IV levels.
- Perform Absolute Valuation: Compare current IV to historical IV.
- Perform Relative Valuation: Compare IV with similar stocks or within the same sector.
Conclusion
What I really want you to take note of in this article is that everything is about being able to value volatility. At the most fundamental level we should have the understanding that option prices have the variance risk premium embedded into them. By starting from this point, we are already in the right frame of mind because it intrinsically means that we are already thinking about the value of the options we are trading. From here, the biggest thing that I think you should be taking from this article is the framework for the types of questions that are important to ask when we are thinking about whether an option si cheap or expensive. There are a number of different and creative ways to price an option;. These are two ways which can result in a pretty good analysis of fair value and especially in situations where there is a lot of irrationality driving option prices, it can be a great way for you to cut through the nose, wsee what things are really worth, and make a great trading decision.


