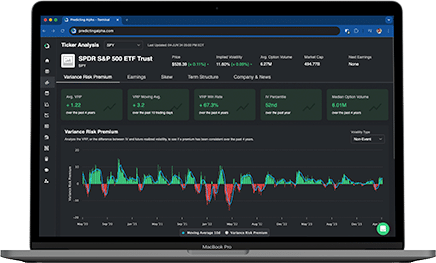
We are going to analyze two years of running the earnings strategy live. This journal was provided to us by a long time Predicting Alpha member, Jay, who meticulously tracked every single trade he took while running the Earnings Premium Strategy since October 2022.
Jay made $224,914.81 and a 89.97% return in two years while taking 1,380 trades.
Want to see every single trade? Click here to open the spreadsheet.
This analysis is split up into 3 parts:
Part 1: Performance Review that covers all the key statistics of the strategy and provides you a full breakdown of all 1,381 trades.
Part 2: Trade Process that covers how Jay ran the strategy. How he found, analyzed, and managed positions.
Part 3: Q&A interview with Jay where he provides answers to more questions to help you understand how he ran the strategy so effectively.
Strategy Returns & Key Metrics
Over the period from October 6, 2022, to September 27, 2024, Jay ran the Earnings Premium strategy using the Predicting Alpha terminal. He used a blend of out-of-the-money (OTM) strangles and at-the-money straddles, with a preference for the former. This resulted in a total return of $224,914.81, which was a 89.97% on his portfolio.
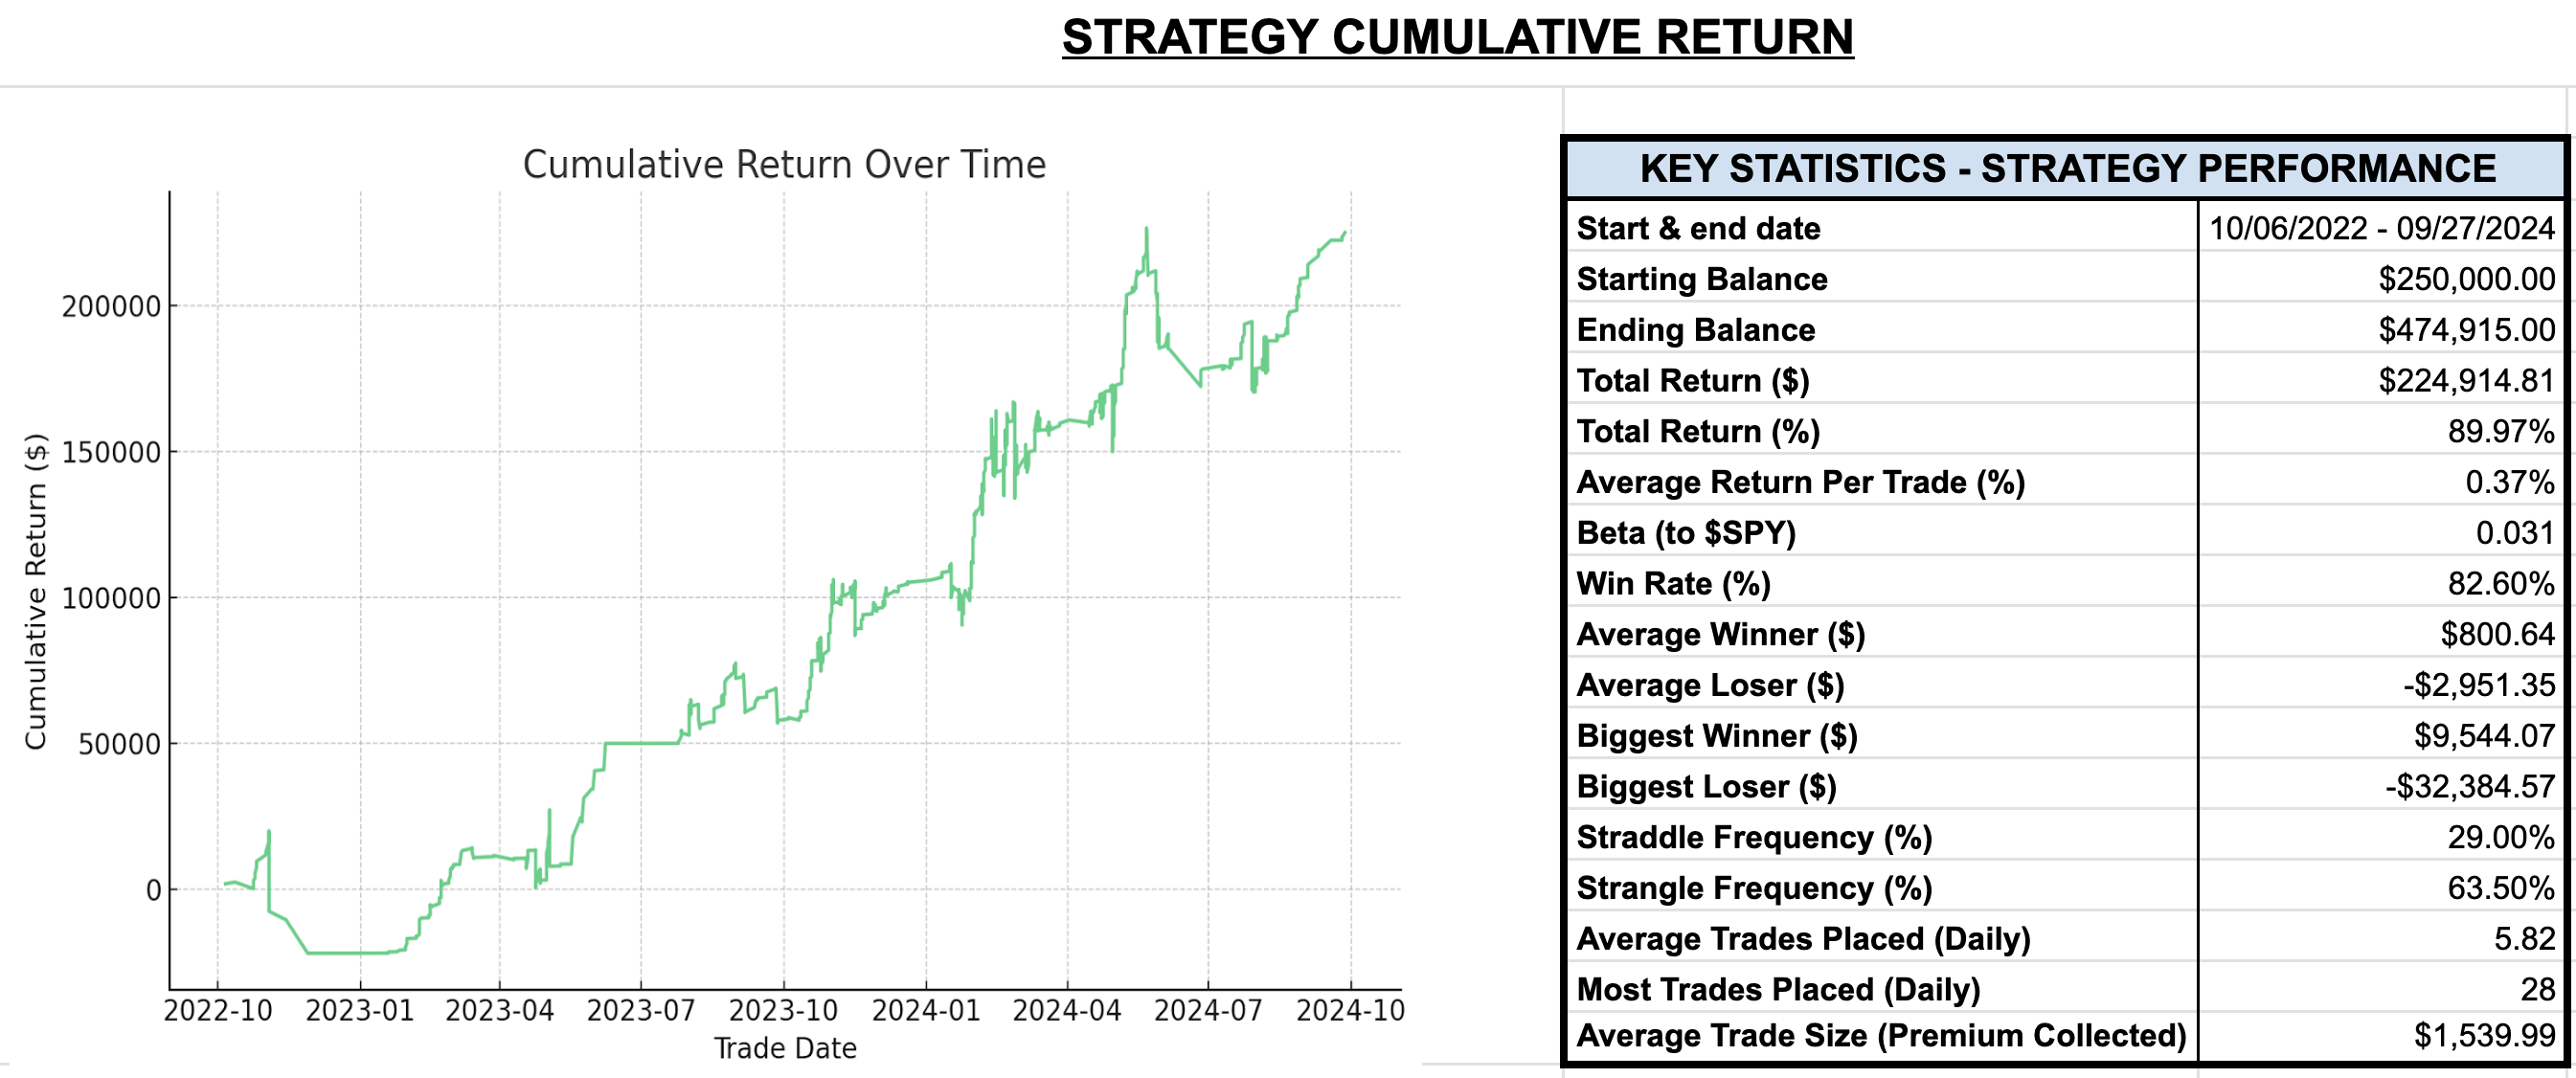
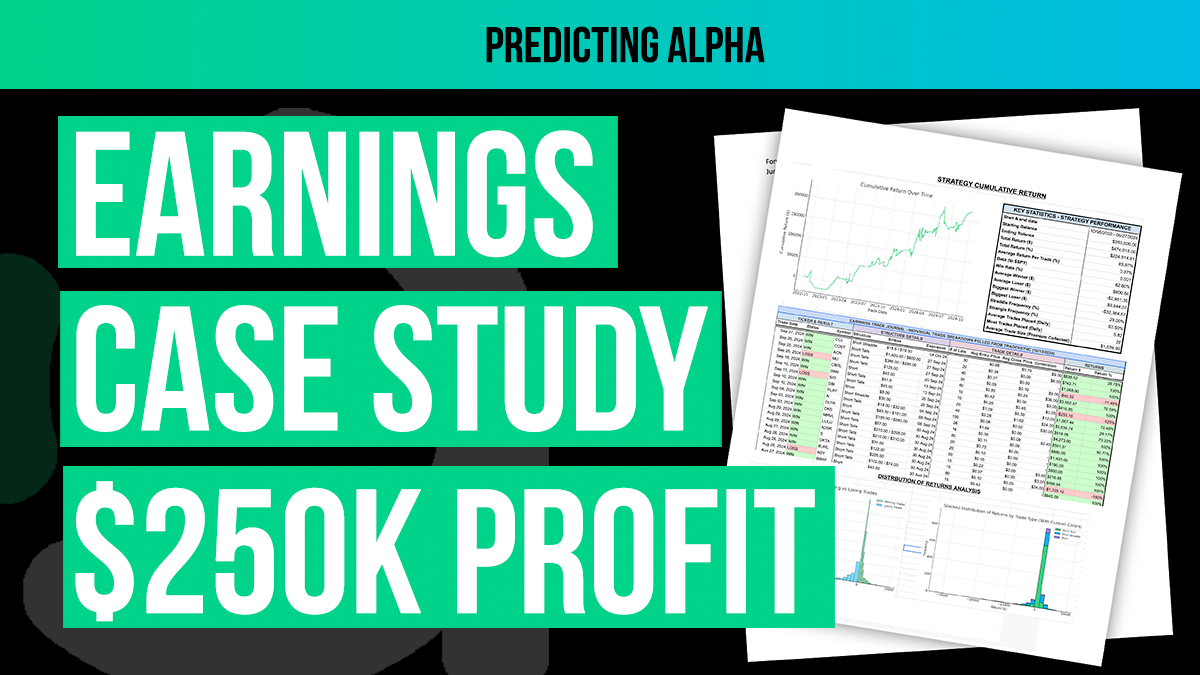
A PnL chart showcasing the earnings Premium strategy performance and all the related statistics.
Full Analysis of Data + Download Link
A full breakdown of the statistics + A detailed log of every trade is available by clicking this link.
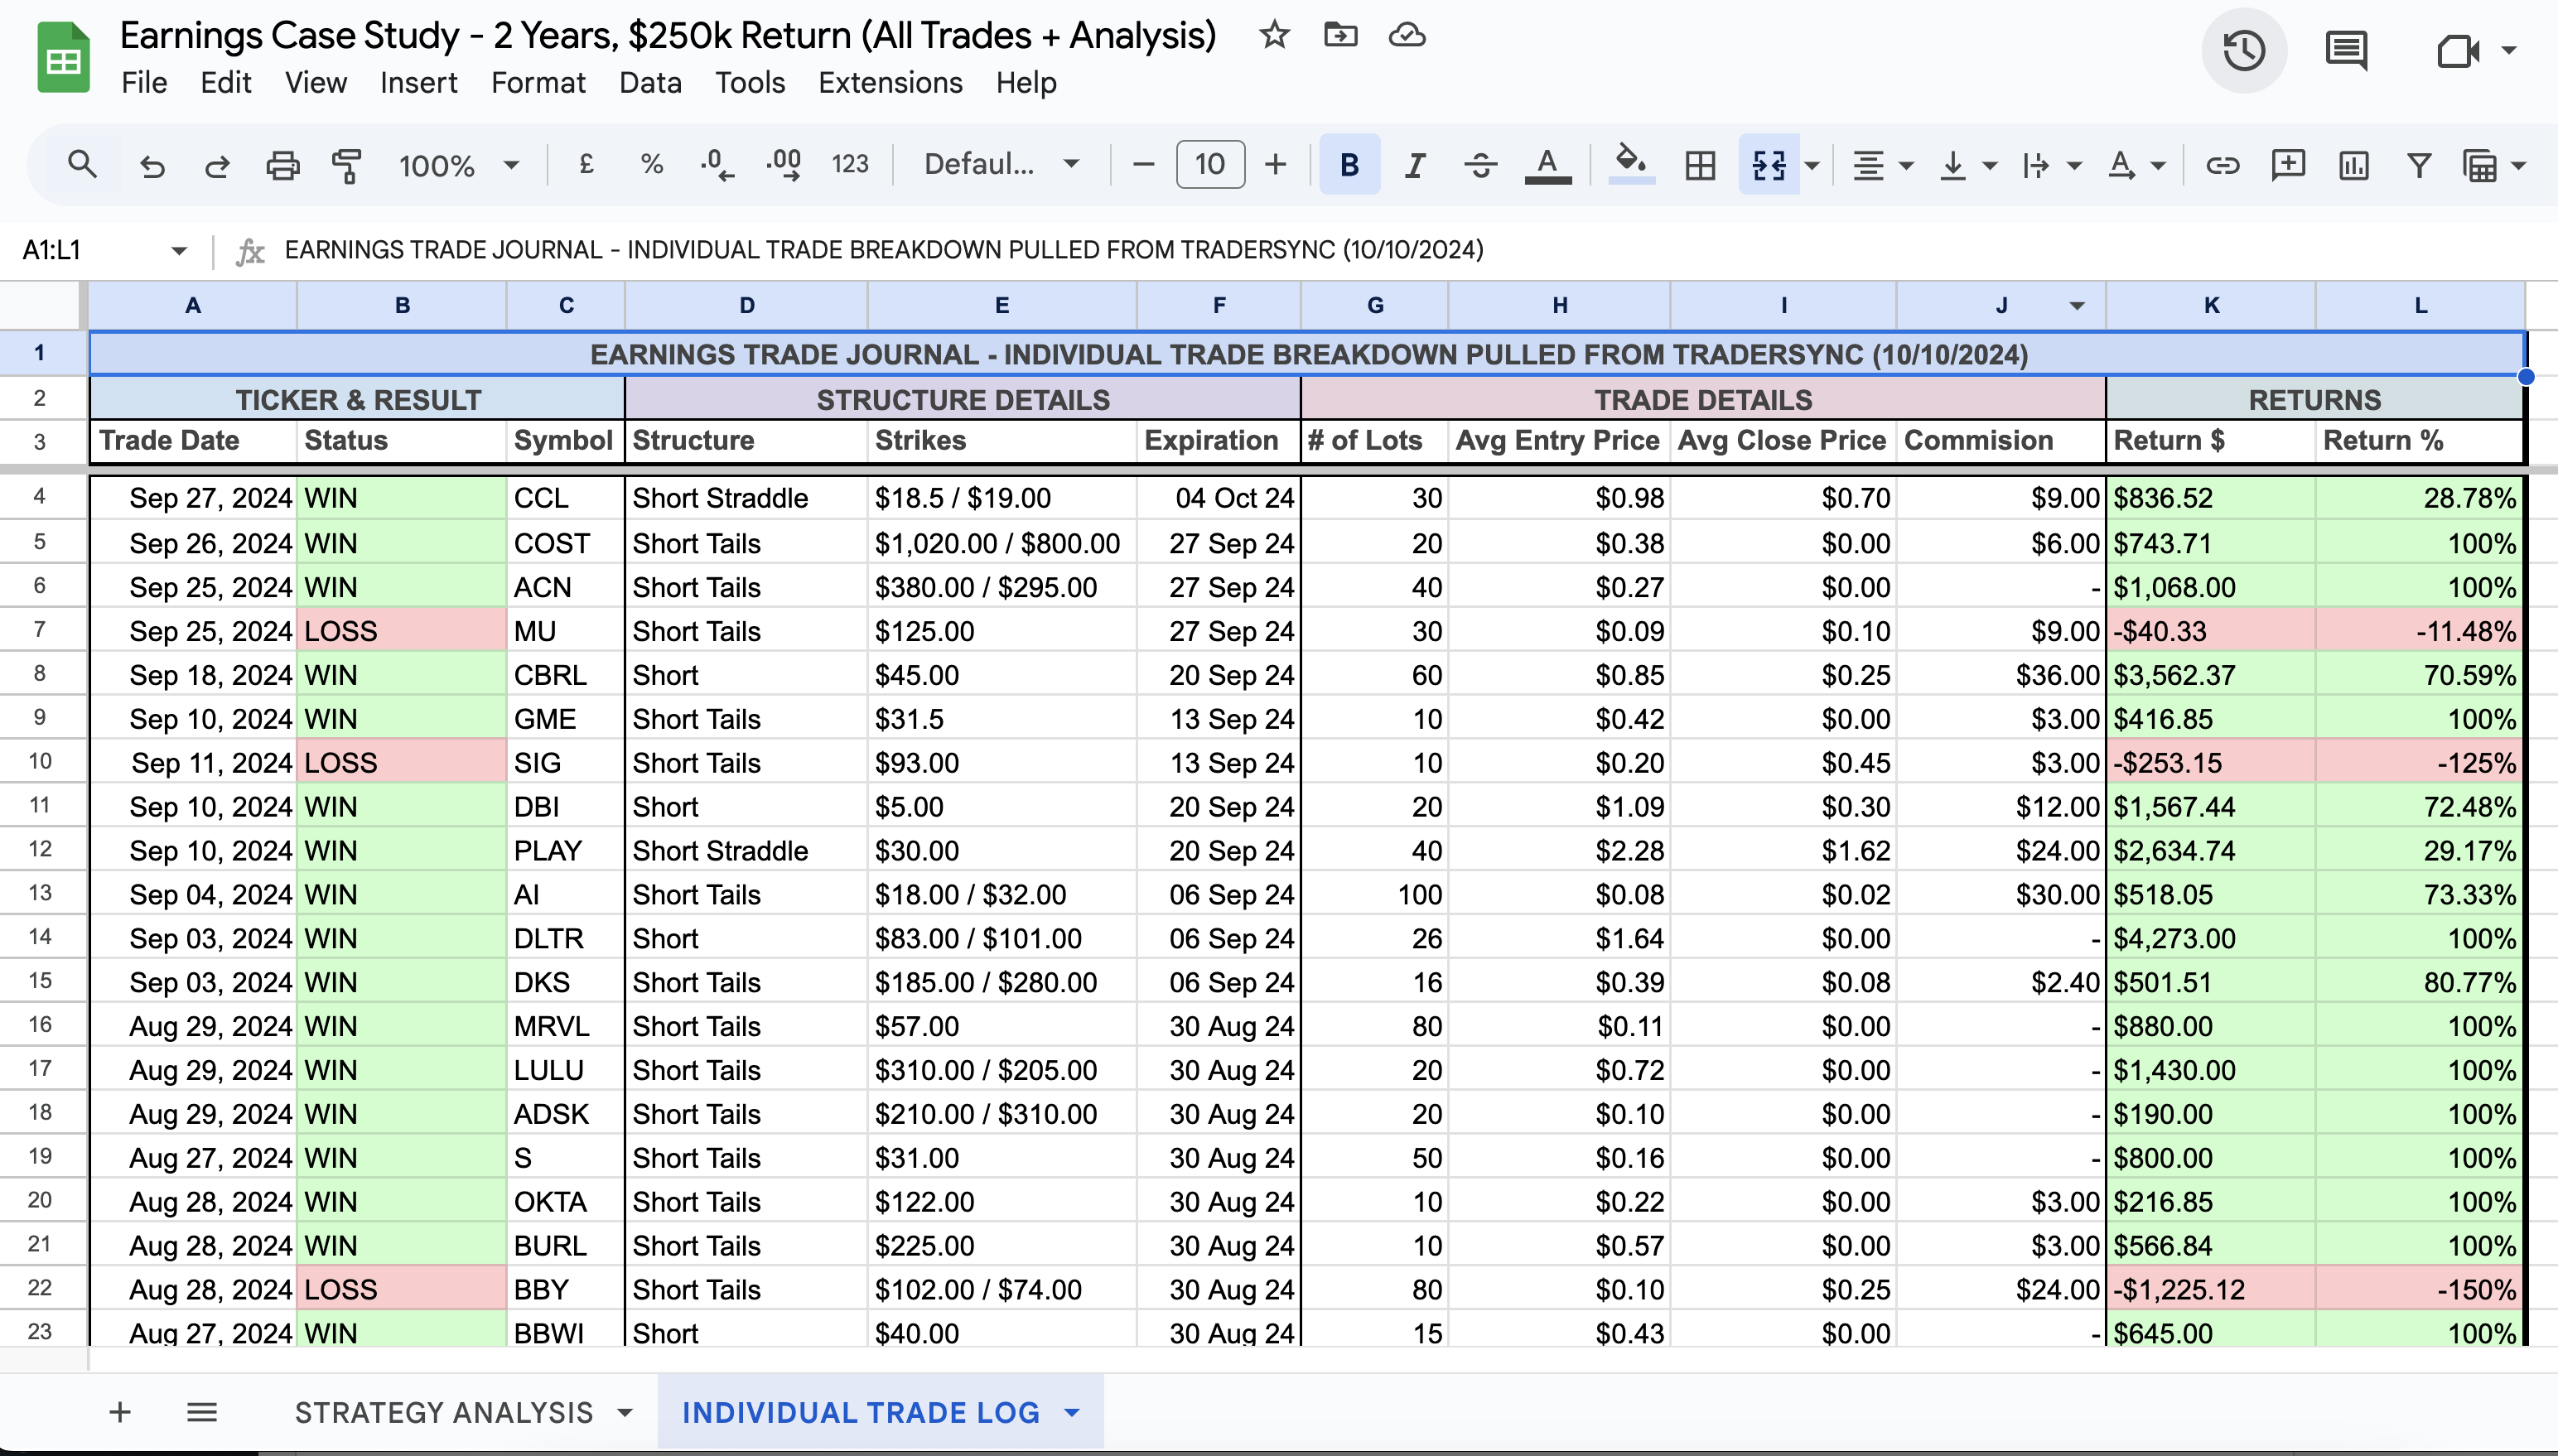
Every trade detail was tracked, creating a perfect log of the strategy performance.
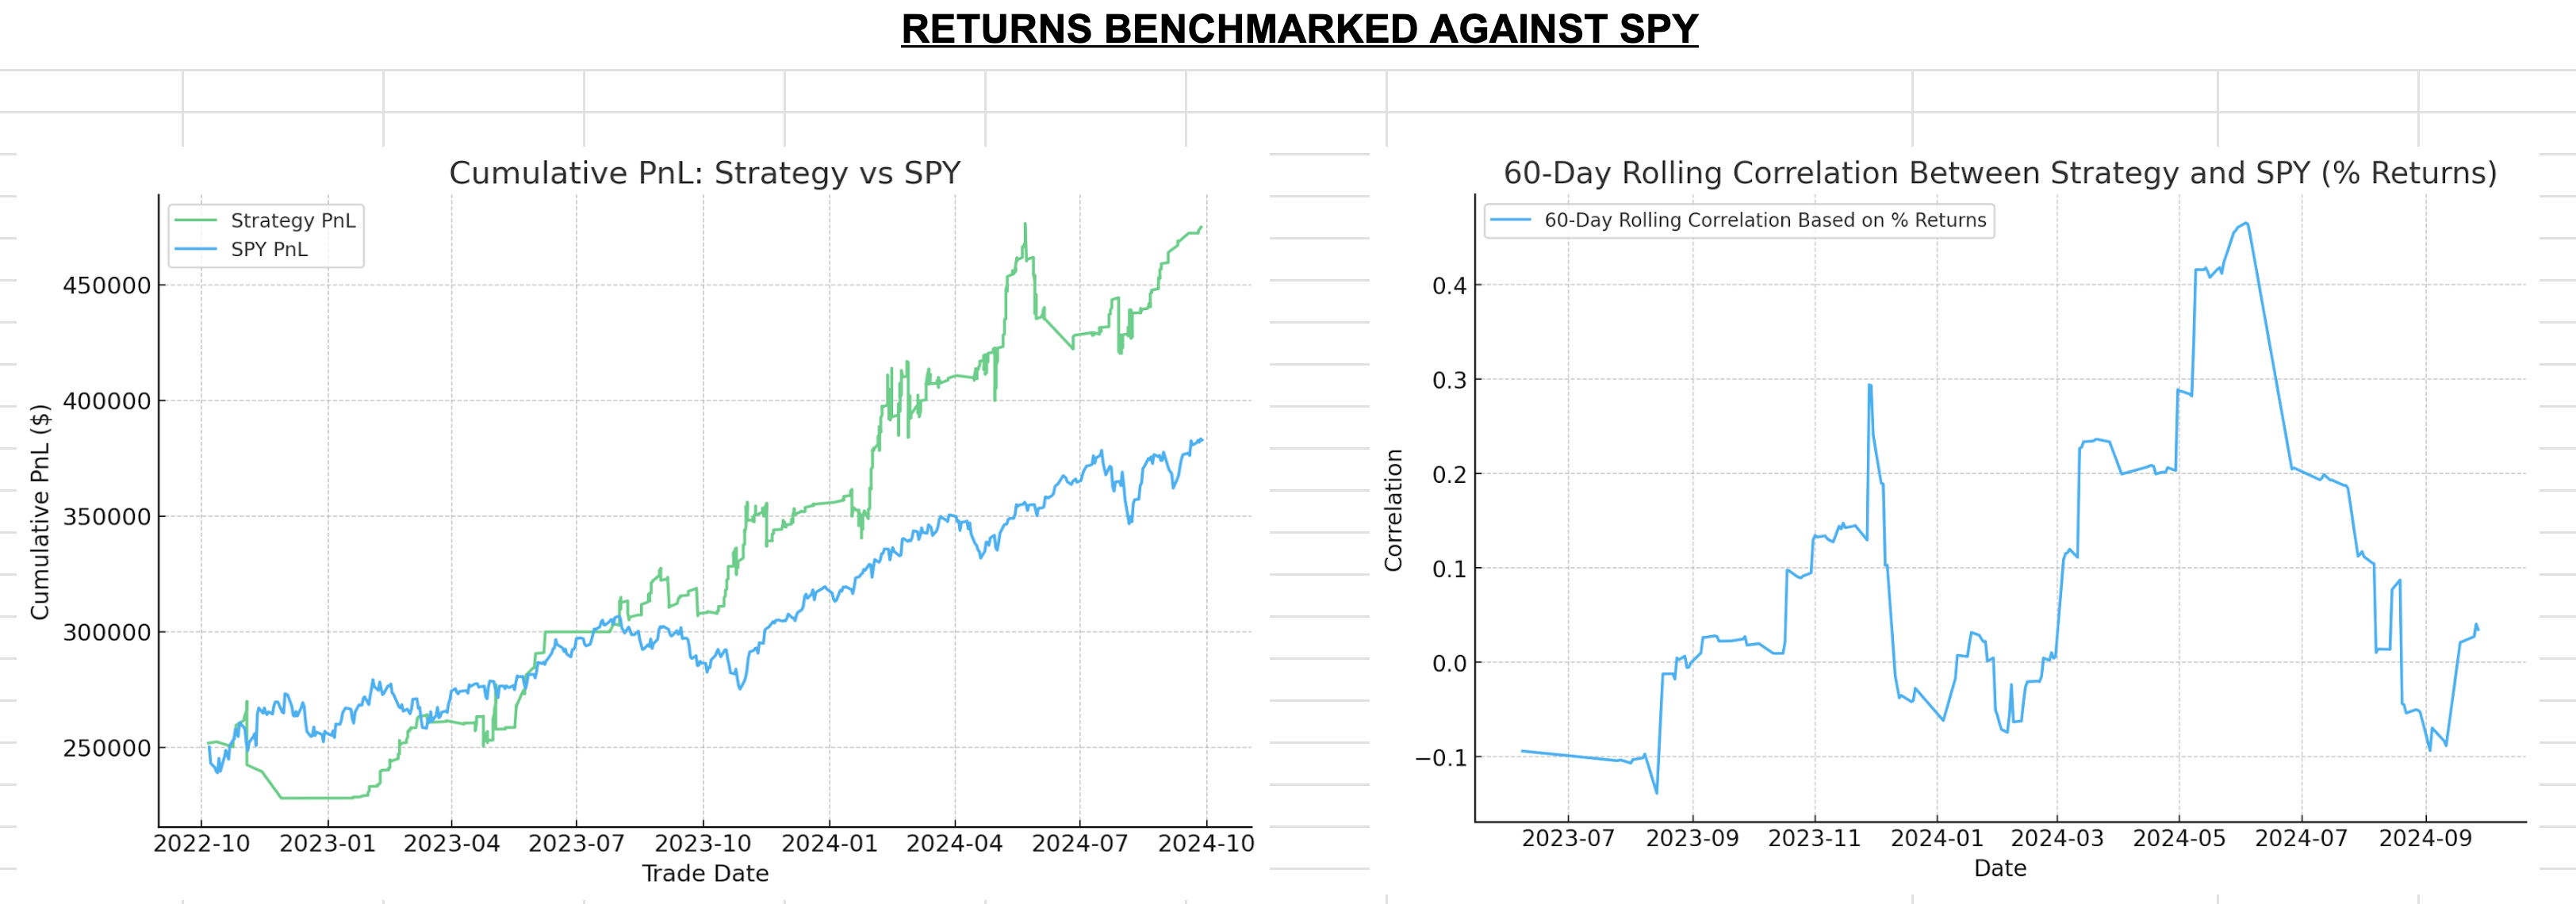
This is how the strategy (green) performed relative to the market (blue). You can also see that the correlation between the two is very low, making it a great strategy for diversification.
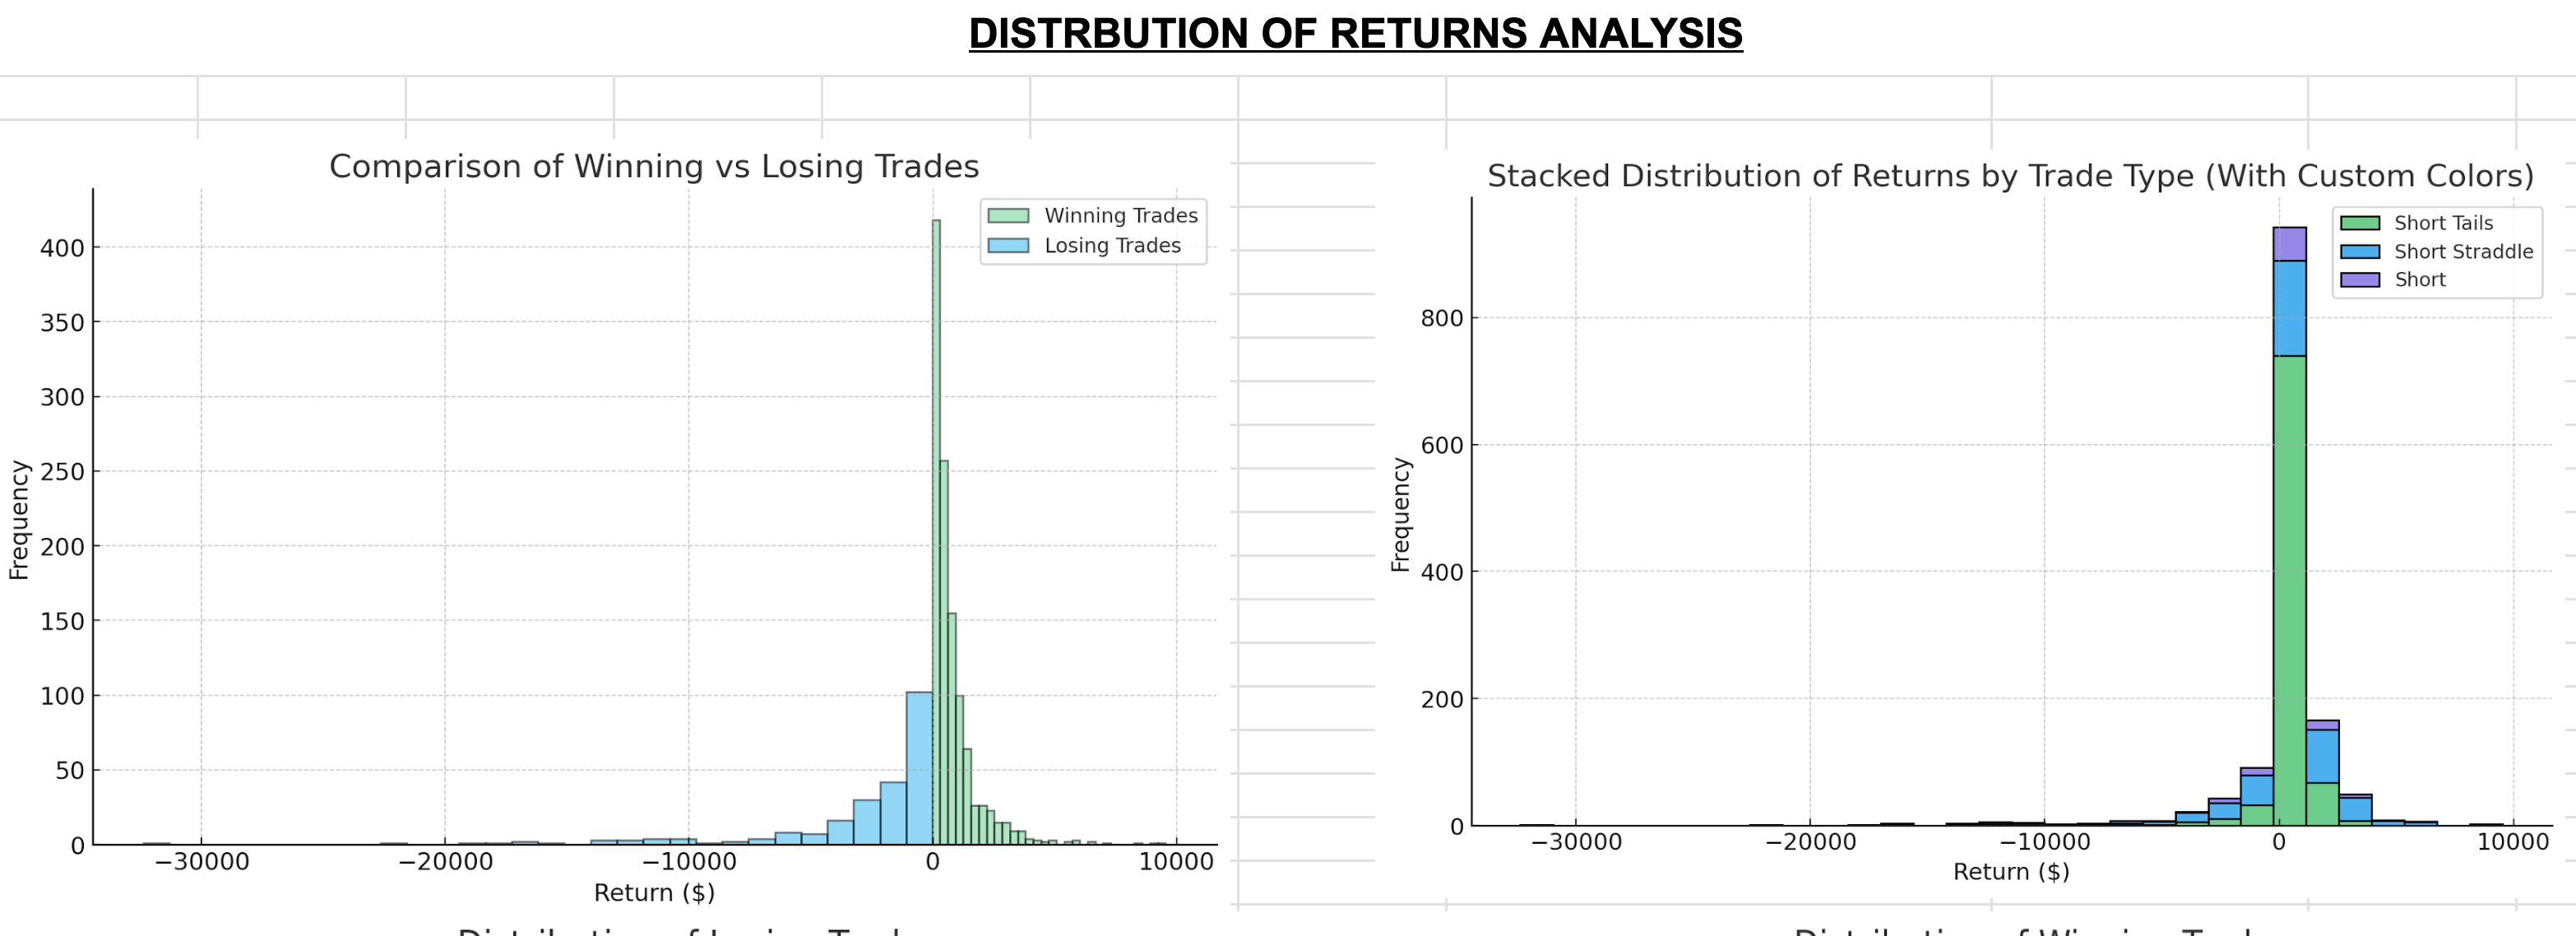
This shows you the distribution of returns. You can see that there is a skewed distribution. The majority of trades are small winners, with the tail risk for outsized losers. These losers are the reason why the strategy returns are so high.
Click here to access the trade log and analytics in a new window
5 Reasons This Journal is so Impressive
- The volume of trades is so large that it’s clearly not luck that lead to these returns.
- The returns account for real time slippage, transaction costs, and learning/mistakes that happen in the reality of running a strategy.
- The correlation to the market is very low, showing how the earnings strategy is a great form of diversification.
- The returns are astronomical, showing how prevalent this risk premium is.
- The PnL variance is relatively low, showing how by taking lots of trades, we are able to control for risk even though we are selling naked positions.
How The Strategy Works
What we do:
We sell straddles on a basket of stocks that have earnings events happening between market close today and market open tomorrow.
We make money when:
The implied move due to earnings is higher than the realized move that actually happens after the numbers come out.
We lose money when:
There is a big surprise and the stock jumps a lot more than the market thought it would.
The strategy is profitable because:
We are able to take dozens of uncorrelated trades every earnings season, minimizing the impact of losing trades and allow us to extract the average premium across the tickers we trade.
If you want to learn more about how this strategy works, click here to read about it.
Let’s go over how Jay ran the strategy for his own portfolio to achieve these returns.
How Trades Were Found
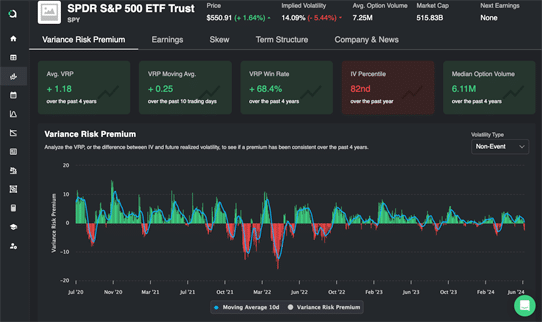
Each trading day starts by generating a list of the upcoming trades. This is done with the Predicting Alpha Terminal.
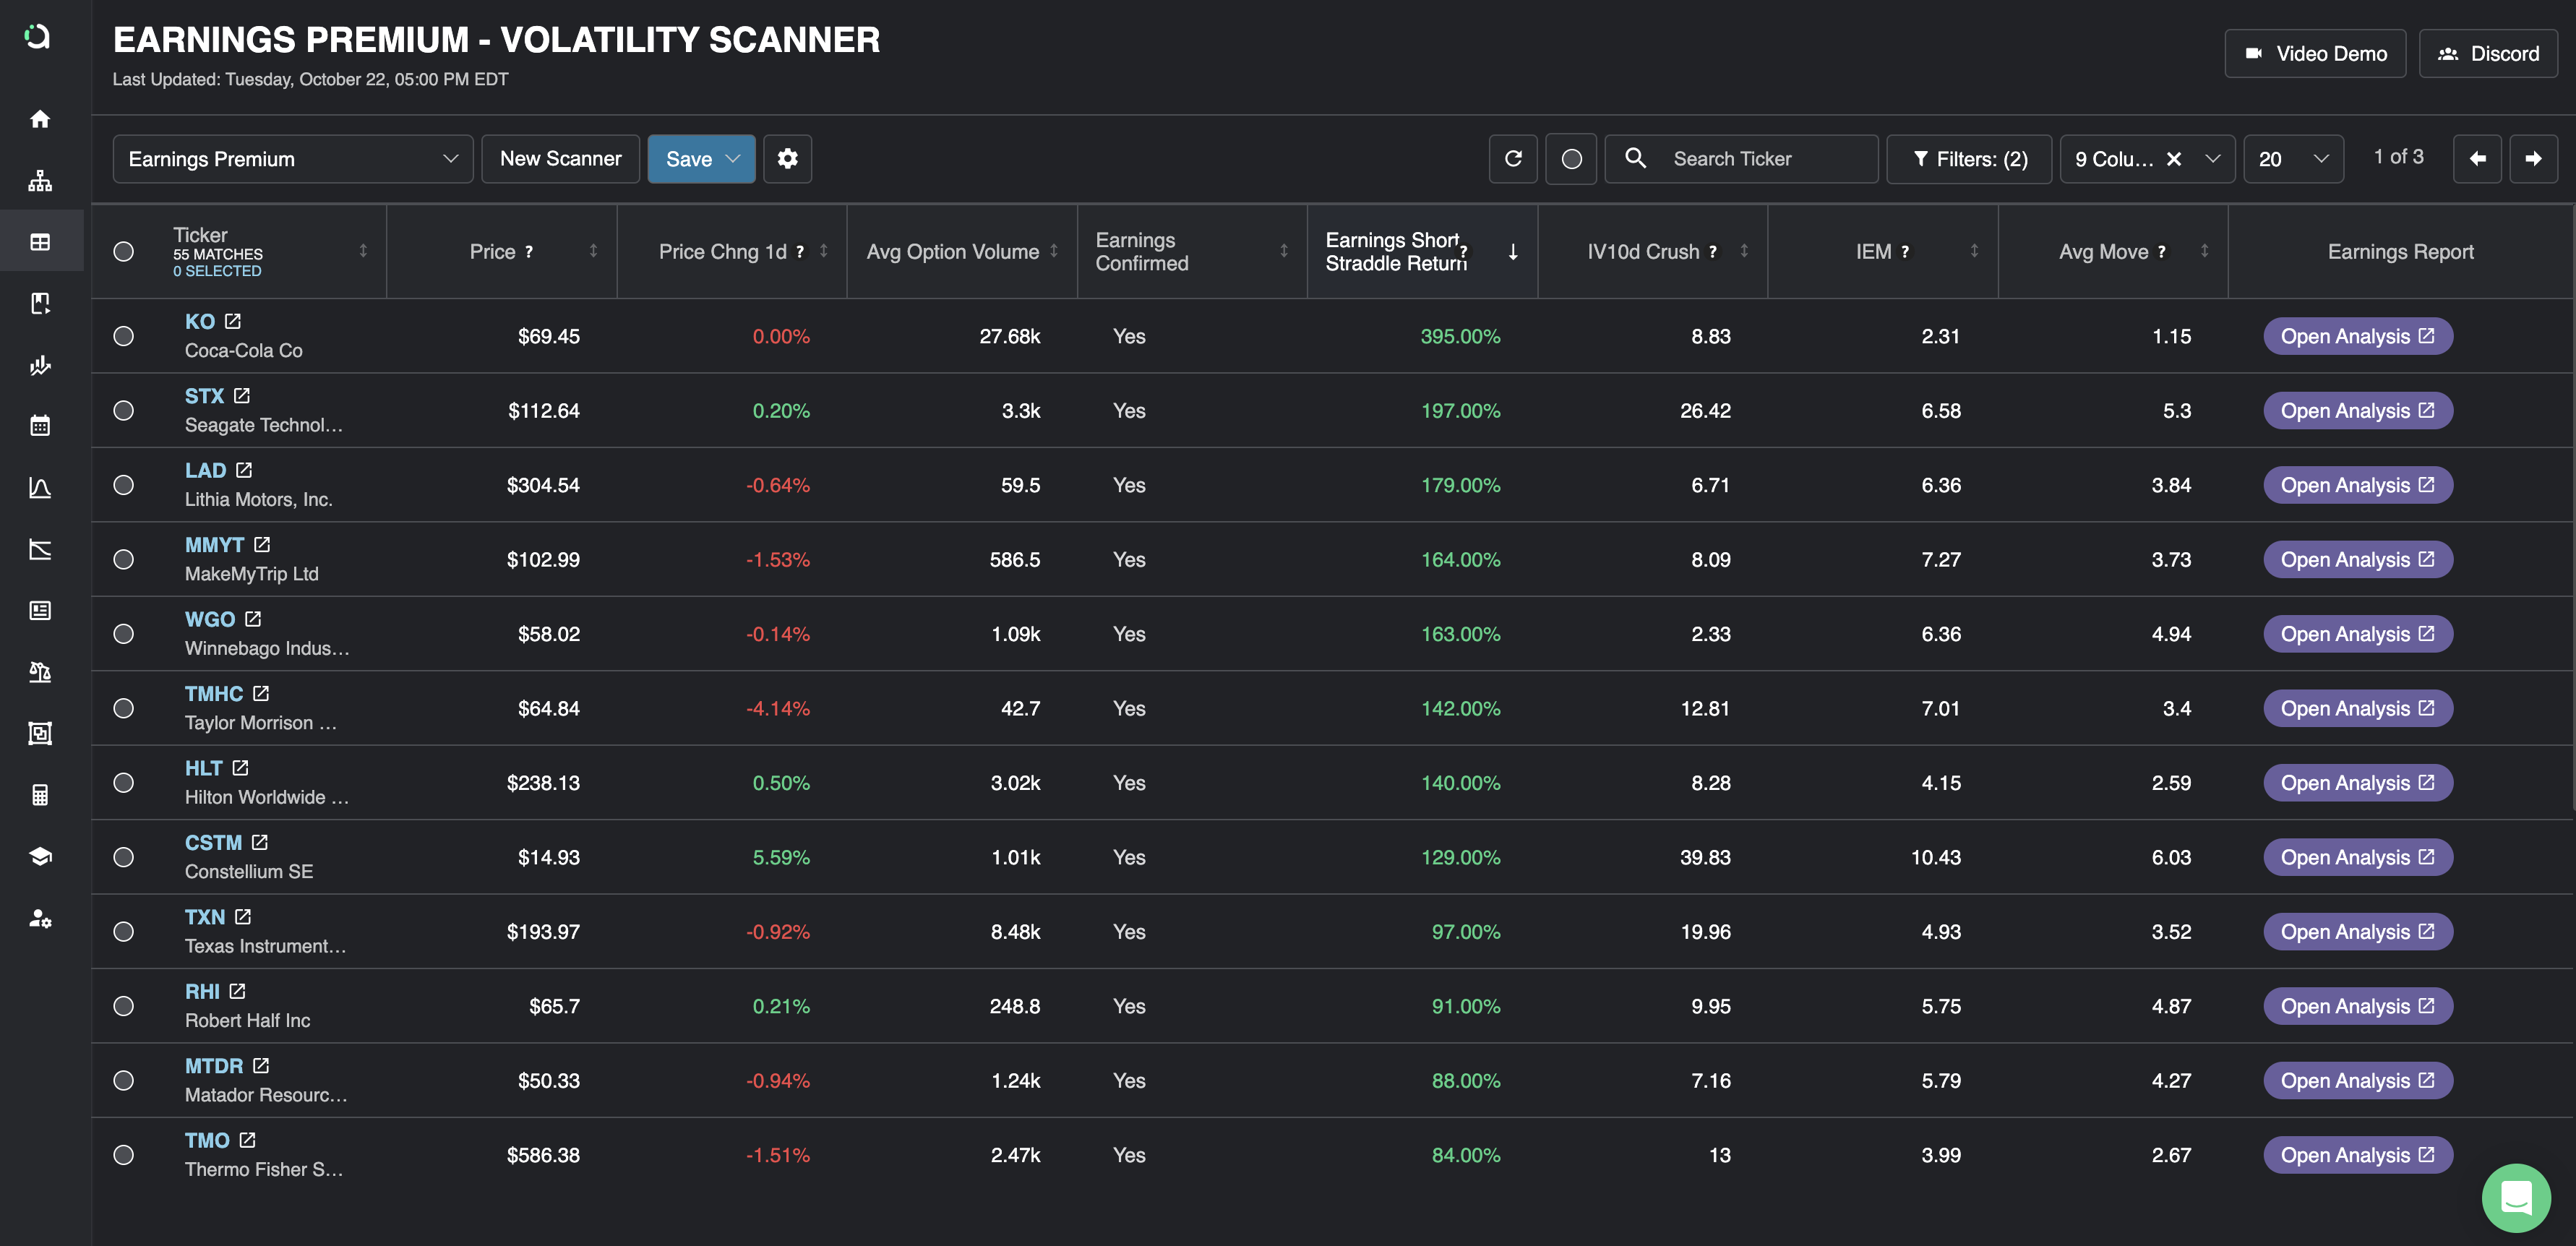
A big part of this strategy is being able to take a high volume of trades, so every ticker gets some care and analysis. Here’s how J identifies trades worth taking:
How Trades Were Analyzed
Earnings Backtest: Straddle Performance
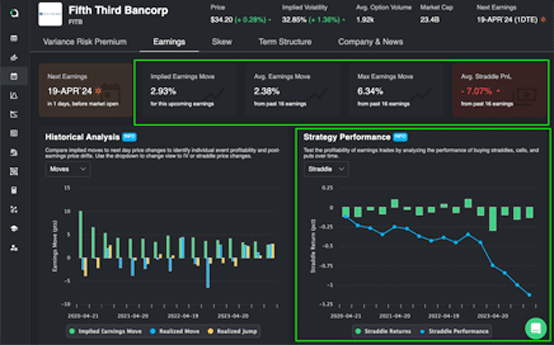
Jay puts a lot of emphasis on how the straddles have performed over time. He uses the backtest that is built into the earnings dashboard for this.
When analyzing the backtest, he looks for a few different things:
- Is selling straddles profitable? We want to see that the cumulative return is positive.
- Is the return smooth? We want to see that the returns reflect a typical short volatility profile. Many small winners, the occasional big loser. The picture above is an example of what a good backtest looks like.
Here is an example of a good backtest:
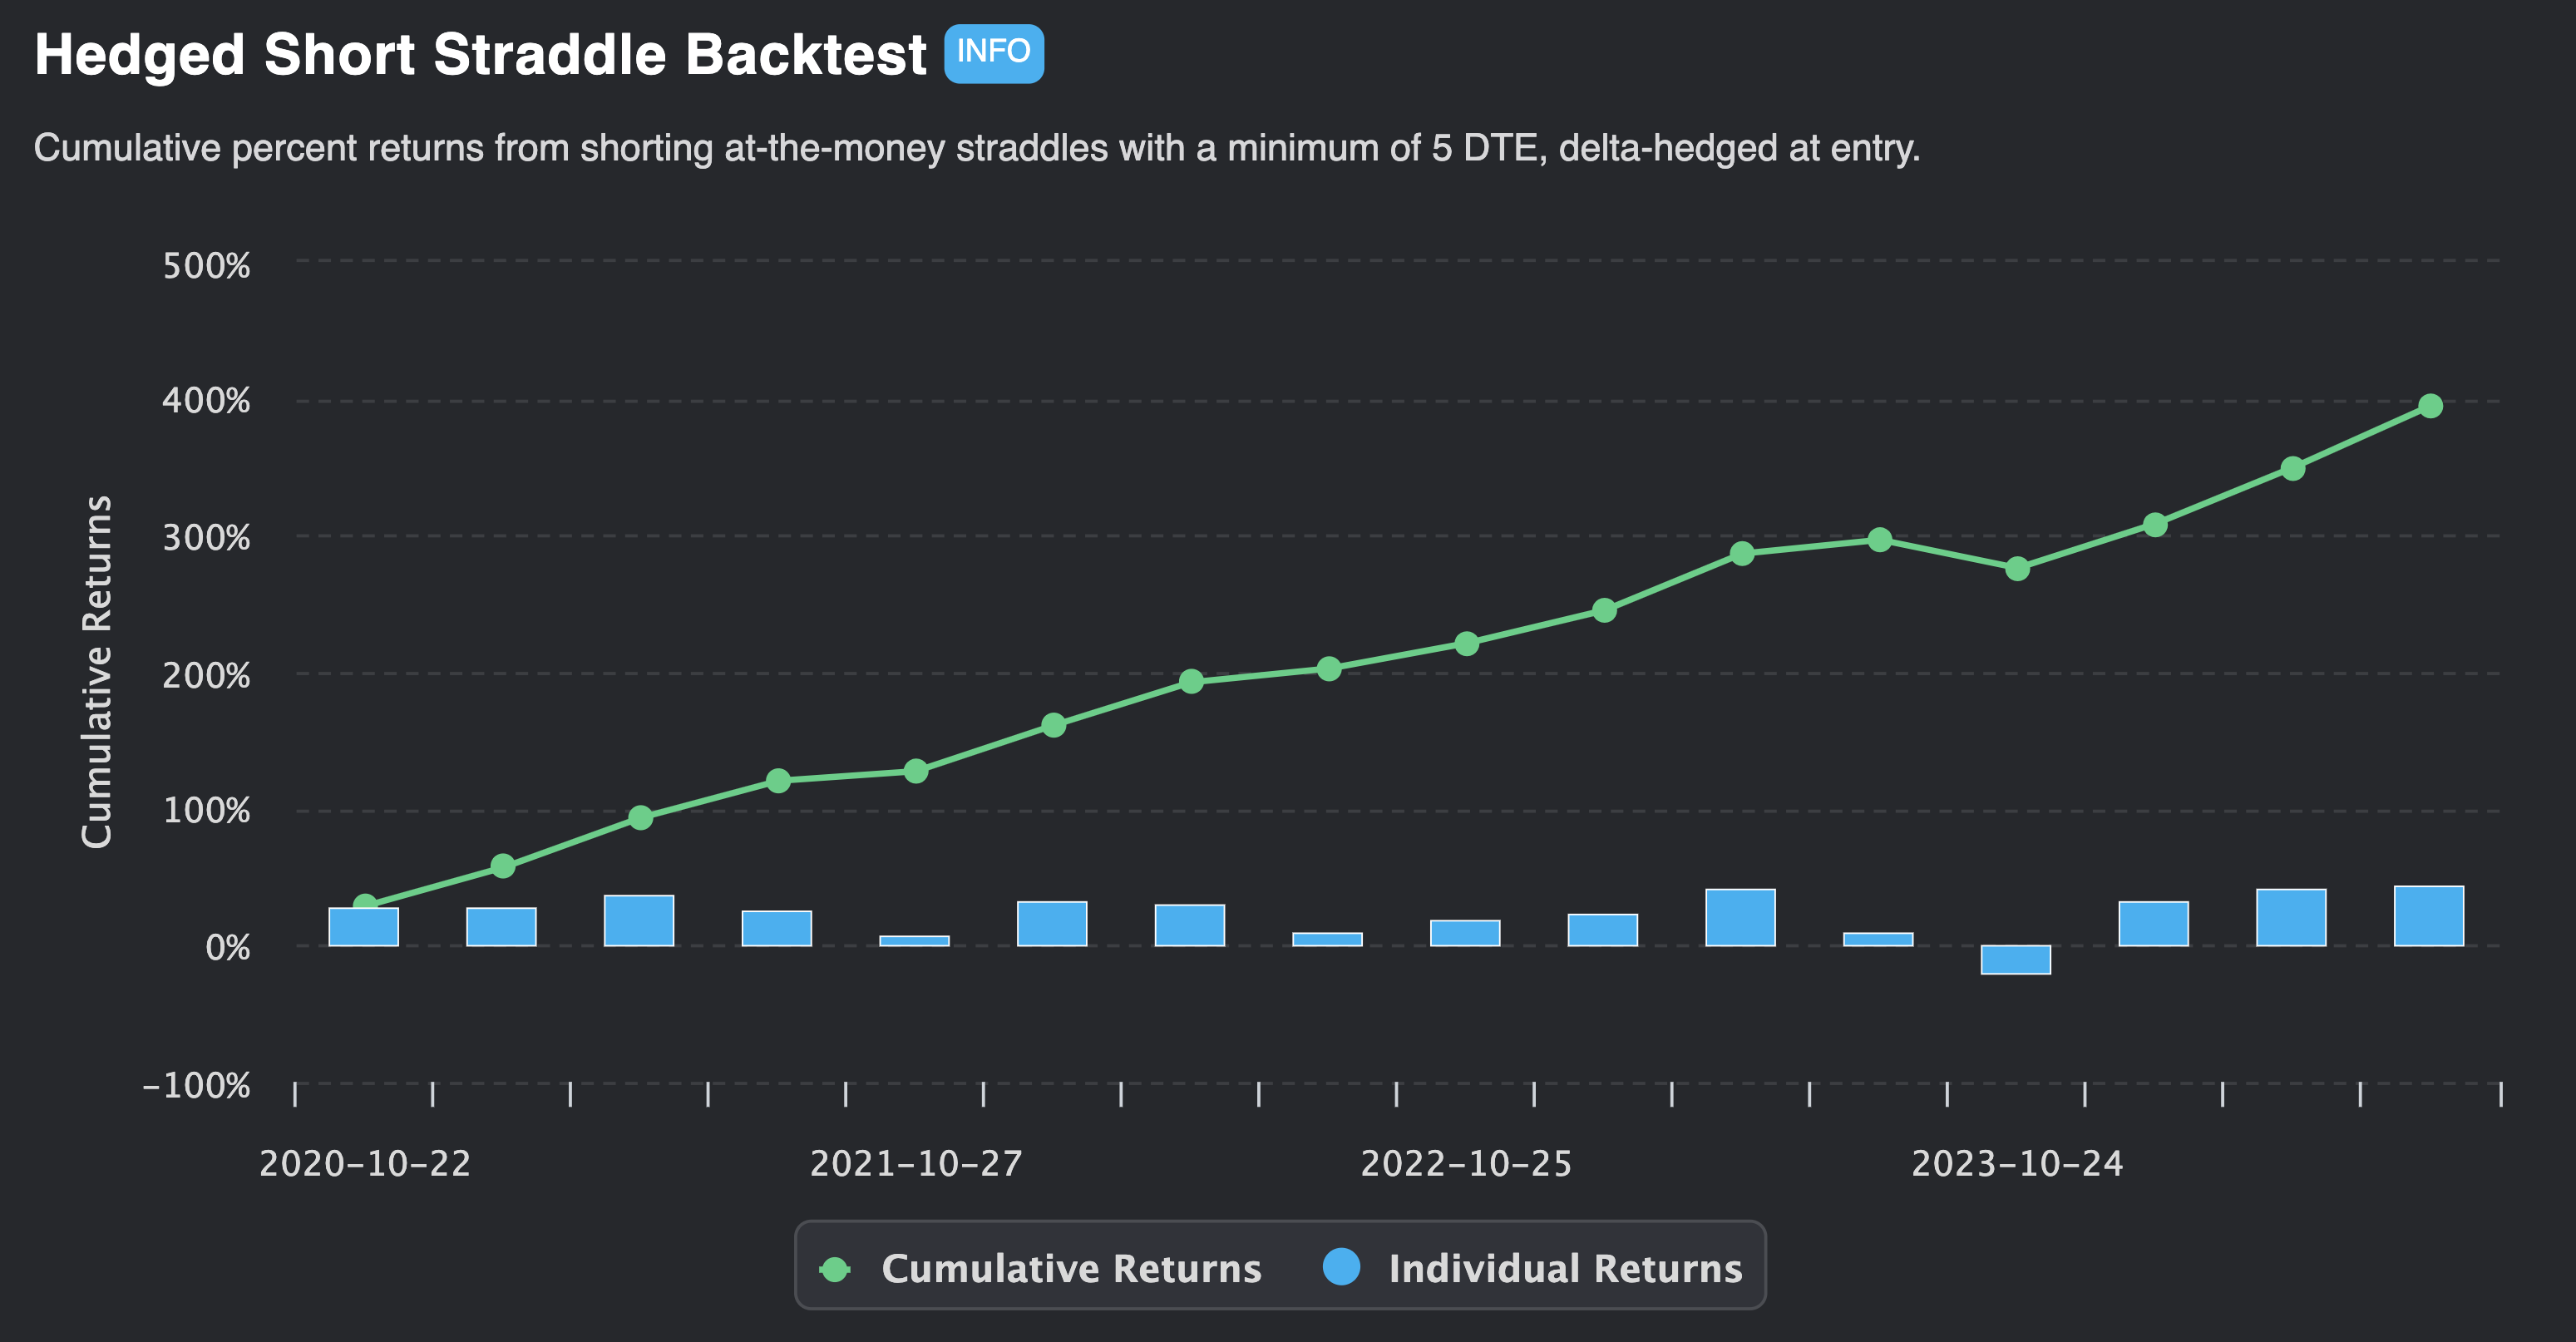
- Positive Return
- Occasional losers, mostly small winners.
Here is an example of a bad backtest:
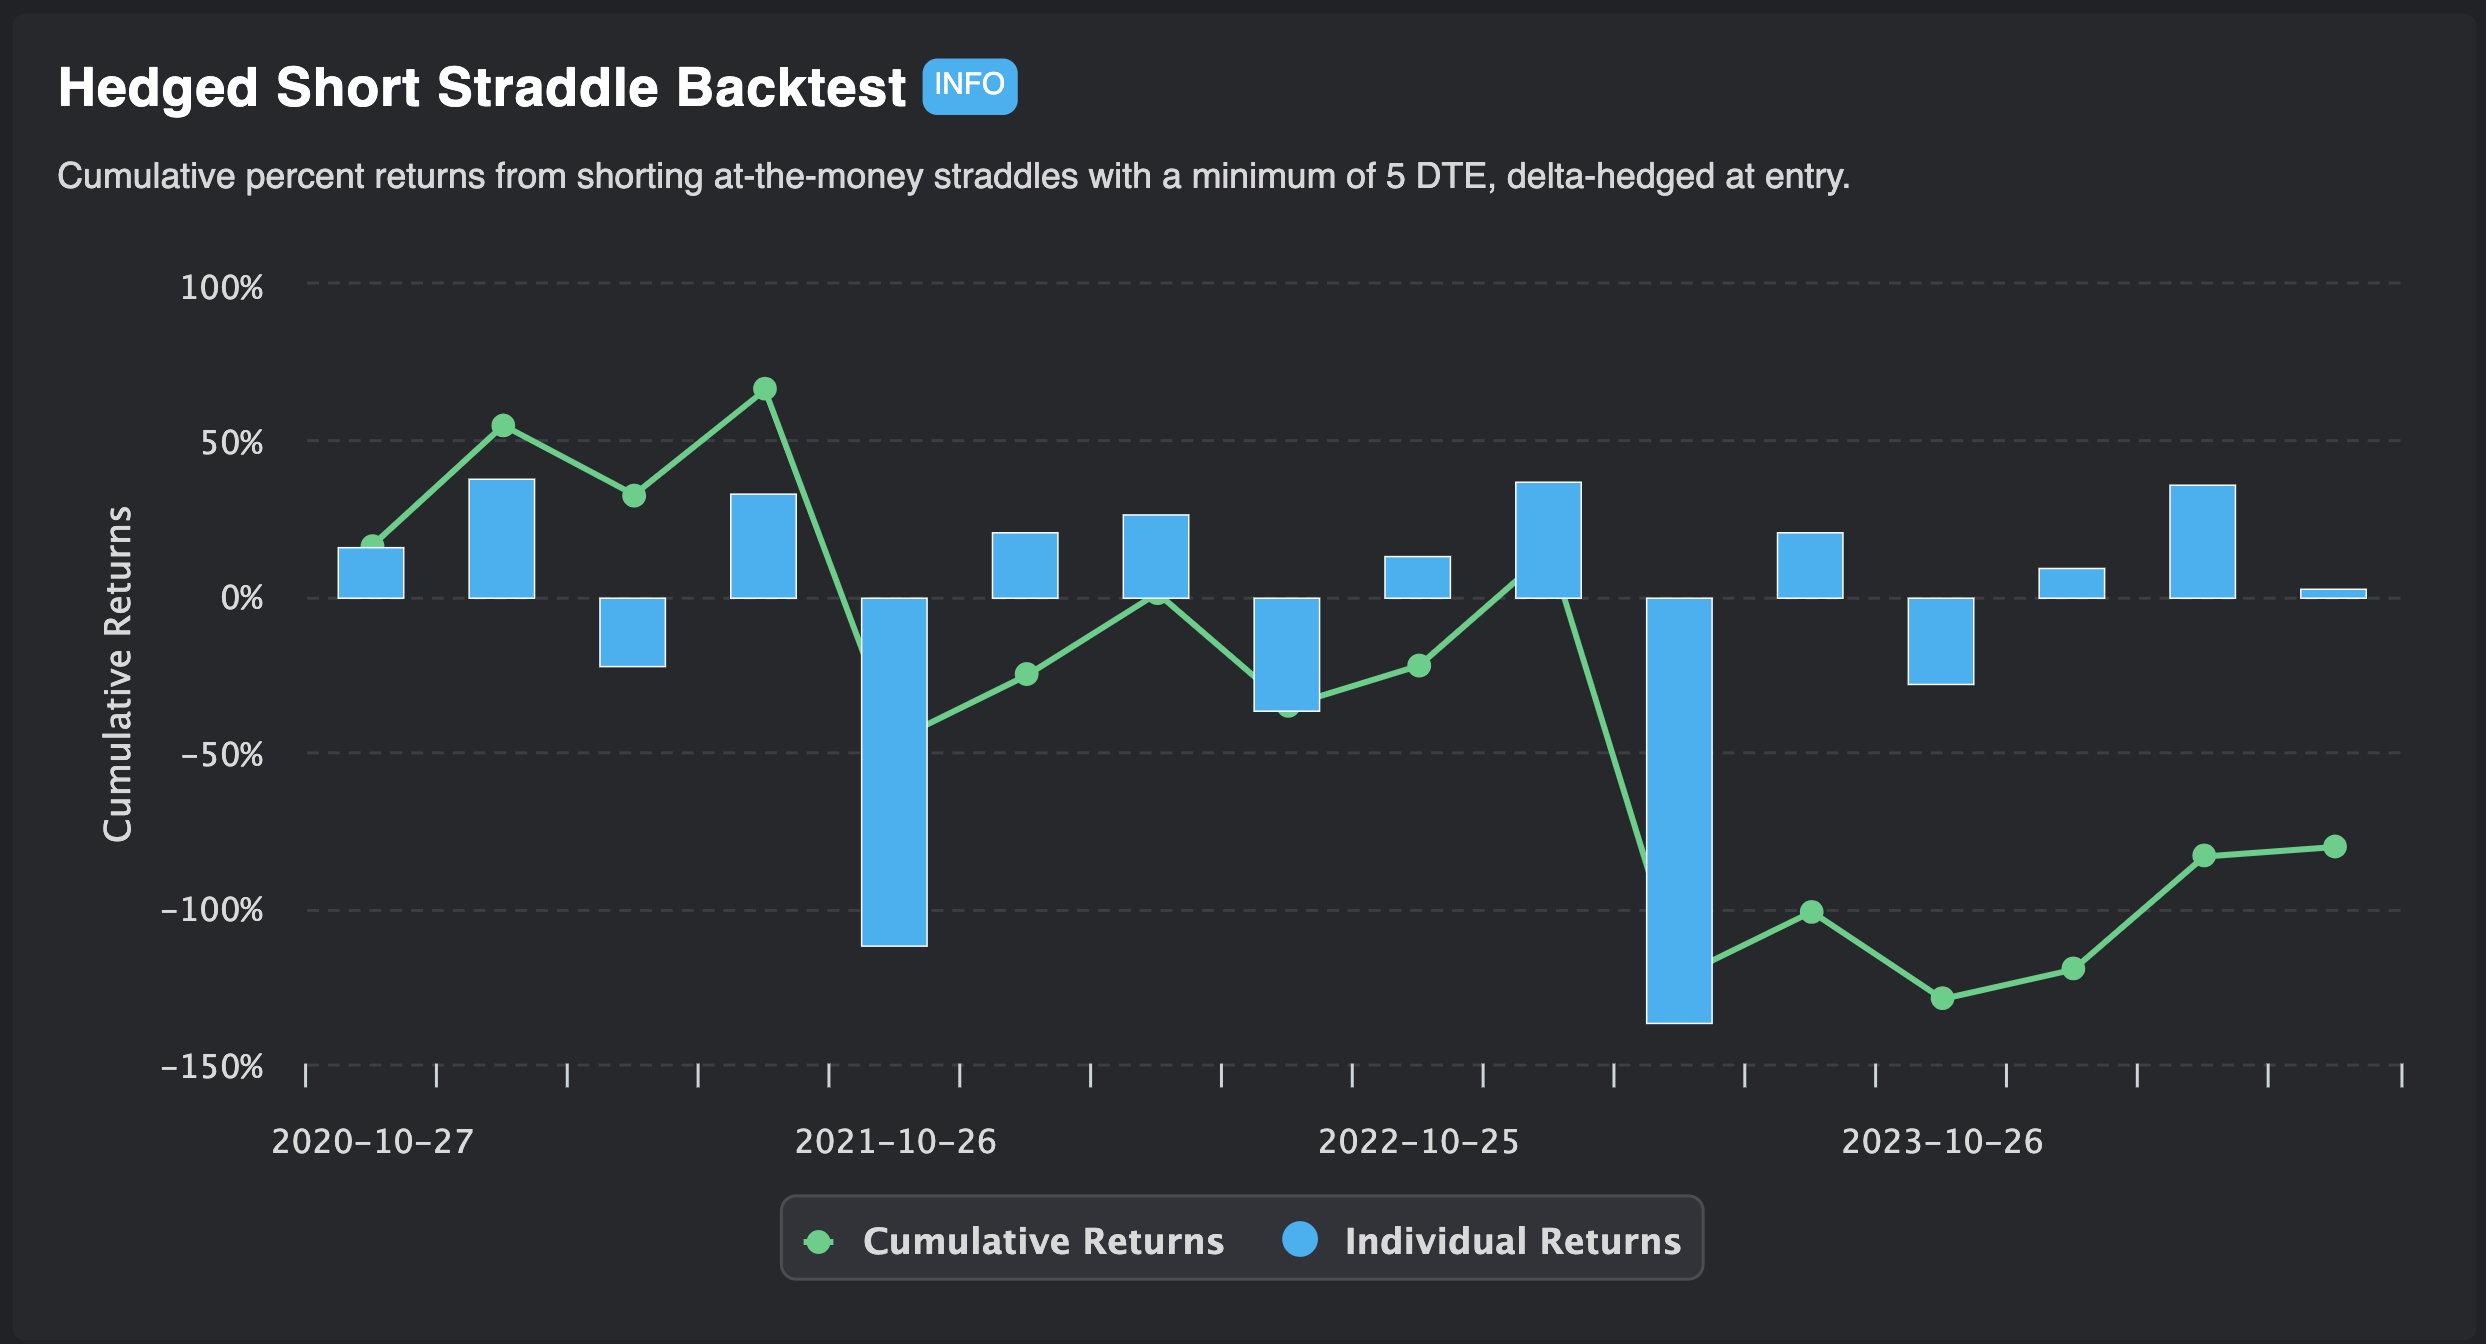
- Negative Return
- Choppy PnL, no consistency in being able to price the risk premium
Earnings Reports and One-Day Moves
Since this strategy revolves around earnings plays, the trader spends a lot of time reviewing historical earnings moves for individual stocks. By analyzing past earnings reports and how a stock moved post-announcement, they can gauge whether the current option pricing makes sense or if there’s an overreaction in the market.
Example of good historical moves analysis
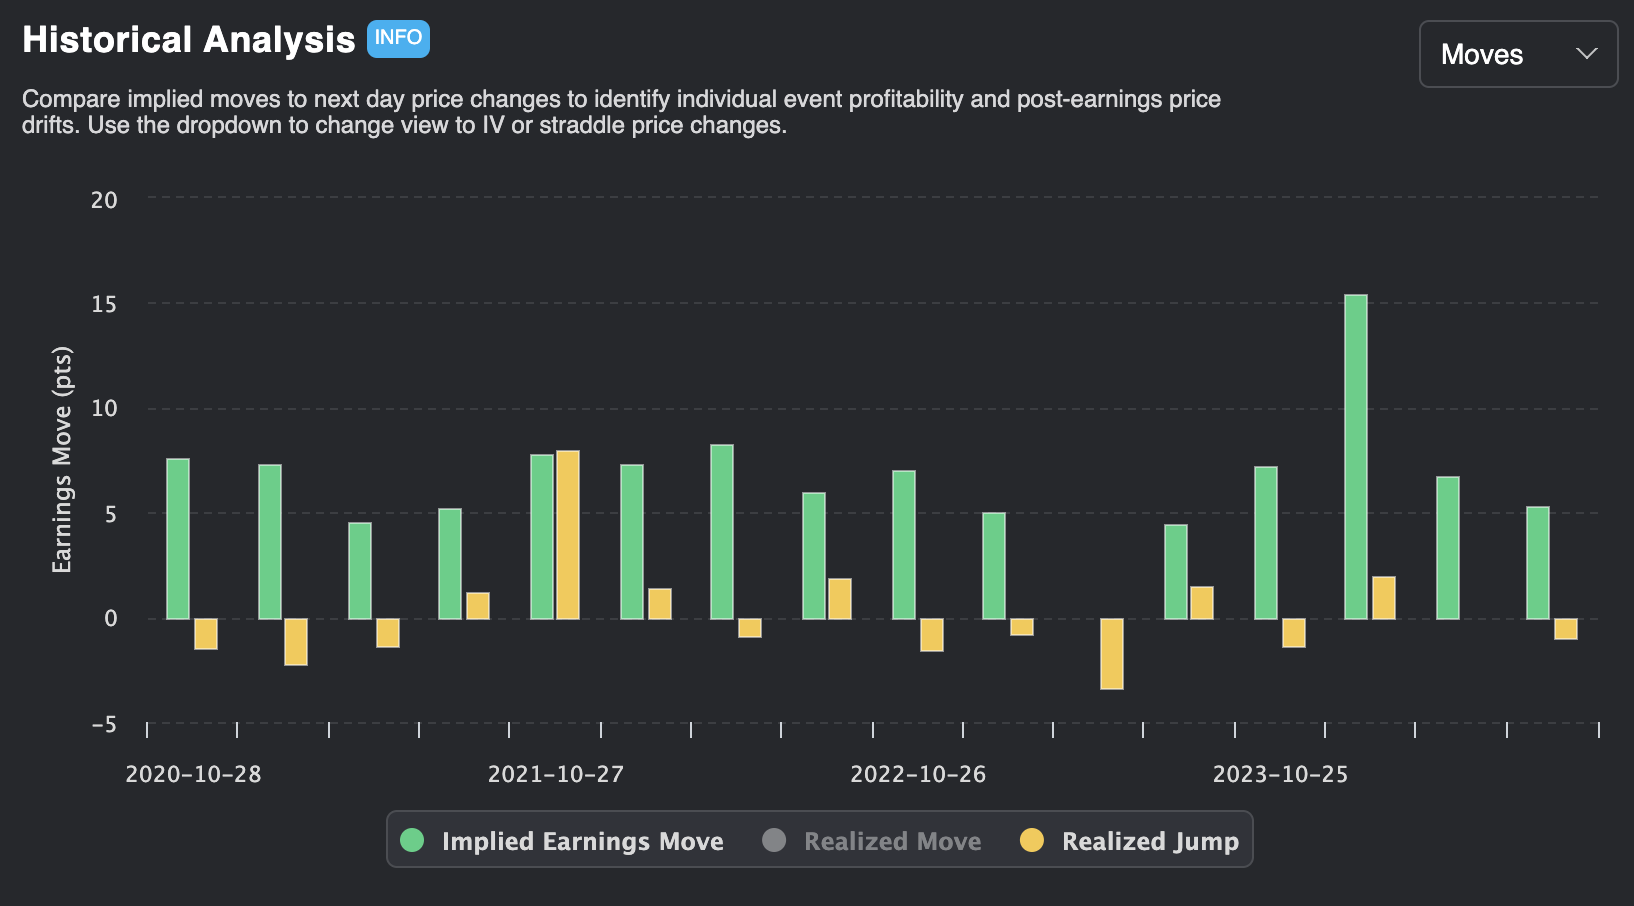
This chart would show that the ticker has very few volatile jumps and that the market is pricing in the risk premium on most events correctly. This shows us that the market knows what matters for a company’s earnings, and is able to accurately price the risk premium into the option prices.
Example of bad historical moves analysis
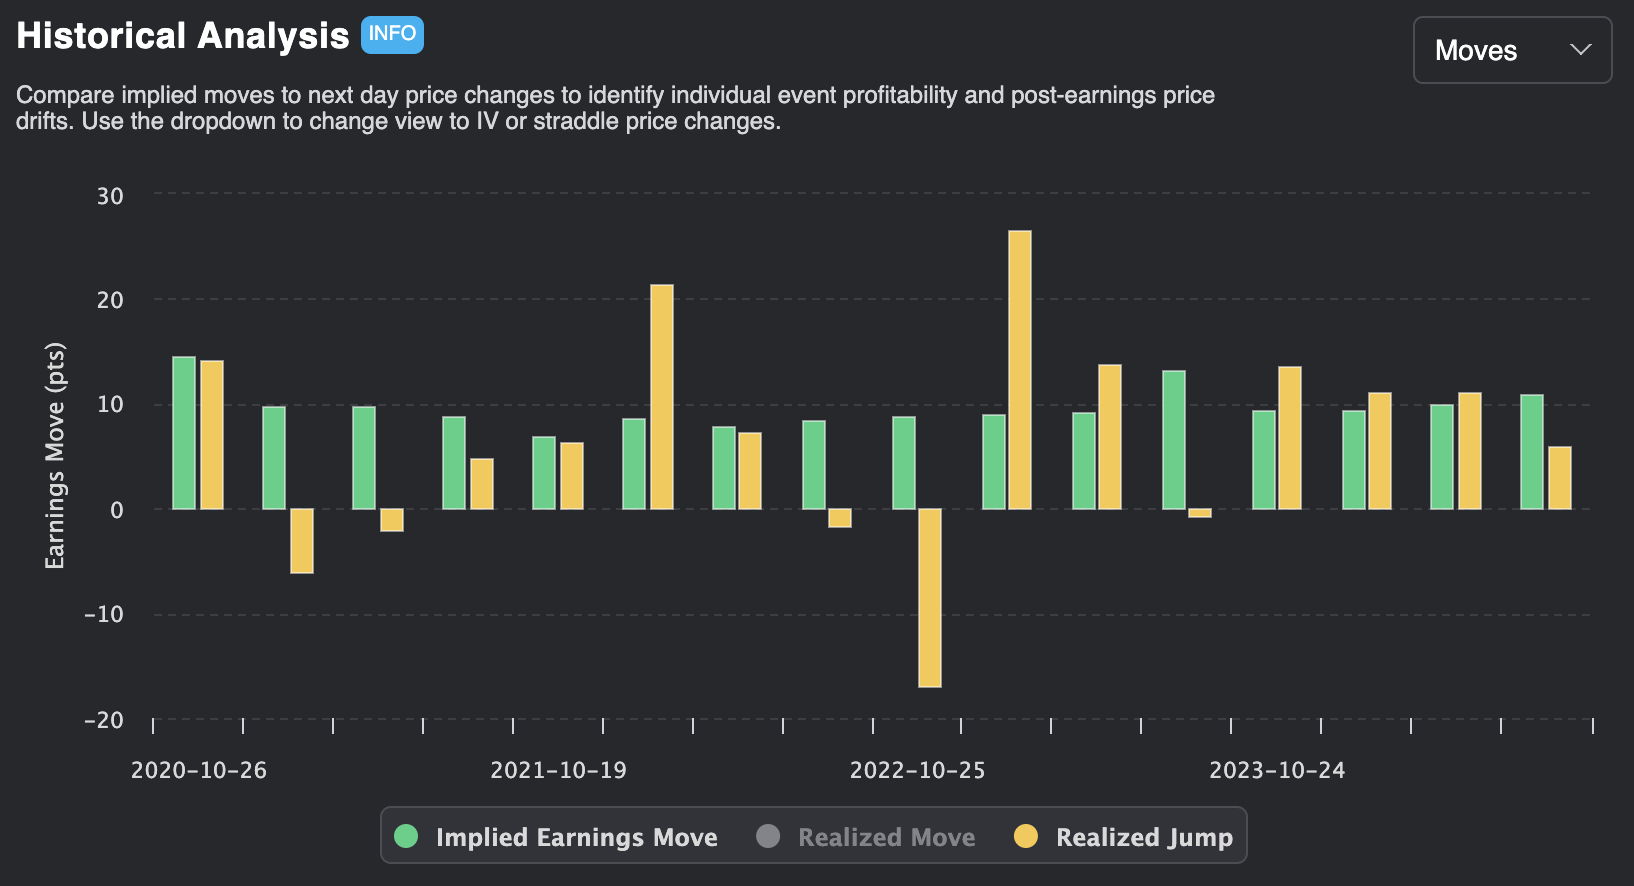
This chart would show that the ticker has extremely volatile jumps and very frequently experiences moves right in the morning that are bigger than the market would imply. This shows us that the market doesn’t really know how to price volatility around this company’s earnings, and for that reason it’s hard to extract the risk premium here.
When Jay sees a ticker that frequently experiences “jumps” that are bigger than the implied move, he may avoid the position or at least size down the trade to account for this added risk.
Structuring and Executing Trades
Choosing which strikes and expirations to trade
Jay would select the expiration that expired closest to the earnings event. So if the event happened tonight, he would trade the options expiring tomorrow if possible.
Jay started off trading exclusive straddles, but over time he started to trade more strangles. He realized that the farther out-of-the-money options appeared to have a slightly greater risk premium plus less probability of going in the money, so he started to prefer selling strangles over straddles because of their smoother performance. He also recognized that the higher win rate and being able to trade many events in small sizes made it possible for him to hold the risk of significant losses on individual trades, which is why his returns are relatively smooth compared to how much profit was generated.
Trade entry and exit

Jay always aims to isolate the earnings event as much as possible. This means that he would enter his trades close to market close before the earnings event was scheduled to happen, and then aim to close out the position in the morning after. The diagram below shows the general approach.
Q&A With The Trader
Tips for New Traders:
What advice would you give to someone considering running this strategy for themselves?
Trade at a max risk significantly less than what you think you can handle (25% of your expected trade size). If you can’t handle crossing the spread to get out when you see danger coming, only sell straddles. The deeper out you go, the faster losses multiply, and it is the tail events that get you.What should traders watch out for when executing this strategy?
“If the market is doing something that makes no sense to me or moving in a way I did not expect, get out.”
Example: NKE report isn’t that bad, let me buy some shares post-earnings—it dumps rapidly at the open. Get out immediately.Are there any common mistakes that you made early on that others can learn from?
Don’t try to hold onto losers, don’t try to fix or adjust your existing trade. If the sky looks like it’s on fire, believe it.How did you determine your position sizes?
My max loss I’m willing to take when encountering a tail event is enough to not kill my account. For a $1,000 max risk trade, a tail event might mean 3-5x this loss on average, so I expect to lose $1,000 but be able to walk away from a $5,000 loss.How did you manage positions while trades were active?
Before the bell, I have all my trades labeled from high to low risk for the order of which ones to close first. I also have a window with all of my tickers on a graph and a watchlist of all my active trades filtered by bid size (the biggest bids would be the biggest trades by size). If there are a lot of trades, I just indiscriminately close them all in order until it reaches a size where I can be more subjective in trade management.What were your criteria for exiting trades?
Time-based. If it’s a 2 std+ move at the open, I base it on my subjective opinion on the report itself.
Learning from Experience:
What did you learn from running this strategy over two years?
You have to be able to sleep at night, especially when you see a really bad report happen after hours in the afternoon/evening. You have to be more conservative in estimating your realistic loss when it’s an outlier, not when it’s the average.How would you analyze this historical events data?

I see in that picture the last 5 are clustered into “very volatile” so if I think the IM’s are too low to reflect that increase I would not sell. I can see the green candles on the last 3 are decreasing in size, so then I would look at the skew to see how the rest of the strikes are priced
If there are any stories you want to tell, please do!
CVS on April 30 represents the sky falling. The loss could have doubled if I didn’t hedge my shares before the bell.
There have been several instances where I traded things that statistically looked okay, but doesn’t reflect the actual liquidity of the stock. I’ve had to close trades that had a few dollars ($5-10) in the spread, and I don’t sell vol if the liquidity looks suspect anymore.
Dealing with Losses:
How did you handle losing trades? (e.g., cutting losses early, letting them run, mentally)
My default response when I’m overwhelmed mentally is to just close everything down and leave the computer. Walk it off for as long as I need. You learn quickly that holding through tail events risks significant damage to your portfolio, but smaller losses are things you can recover from. Deep OTM strikes that become worthless are the only ones I let run; everything else is closed the next day.Did you ever deviate from the strategy during periods of losses, and if so, why?
A few years ago, I would hold for multiple days in hopes that price would mean revert, but it doesn’t really. Tail risk events move in one direction and can move for prolonged periods of time.What was your worst-performing quarter? How did you handle it?
May-August 2024, with lots of 3 std+ moves (that’s the biggest dip in performance chart above). I changed nothing.
Conclusion
Jay’s results speak for themselves: $224k in profits, a near 90% return, and over 1,300 trades meticulously tracked. This isn’t just theory—it’s real-world performance with all the wins, losses, and lessons that come with it. If you’re looking for a proven way to extract consistent premium during earnings season, Jay’s journal is a masterclass in execution. Want to see every single trade and dig into the data yourself? Click the link and get into the details.
And if you want to run this strategy for yourself, with our proprietary tools and community of serious options traders, click here to learn more about our memberships.

