
Every trader has one question that they wanted answered when they find an option trade.
“Has doing this made money in the past?”
That’s why we are happy to introduce our backtesting feature, which is included in every Option Premium Report you generate the PA Terminal.
How does the backtest work?
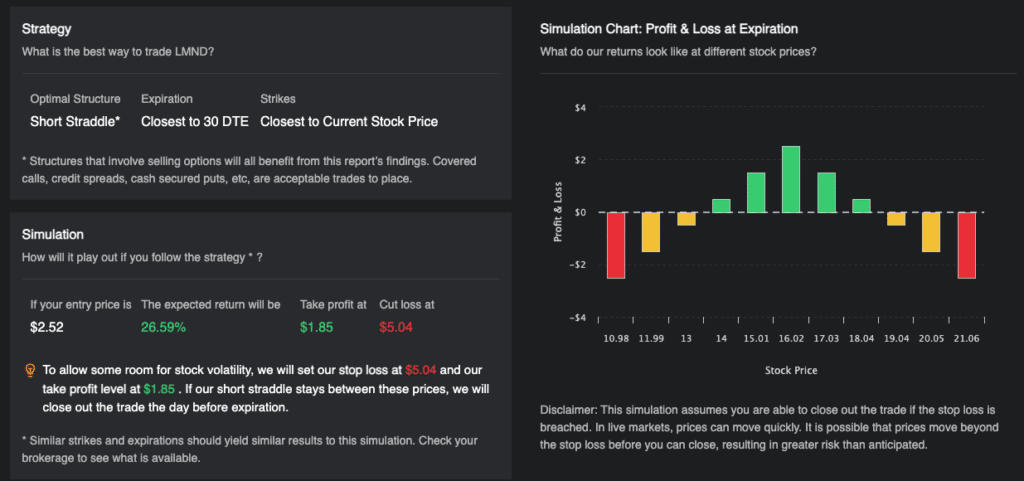
The backtest is a part of the Trade Example Section in our Option Premium Reports. In the first part of this section, our system generates an optimal trade and trade management plan.
What the backtest does is take this trade idea and test it’s performance historically. It works by placing this trade each time the trade rating from the beginning of the report has occurred over the course of the year.
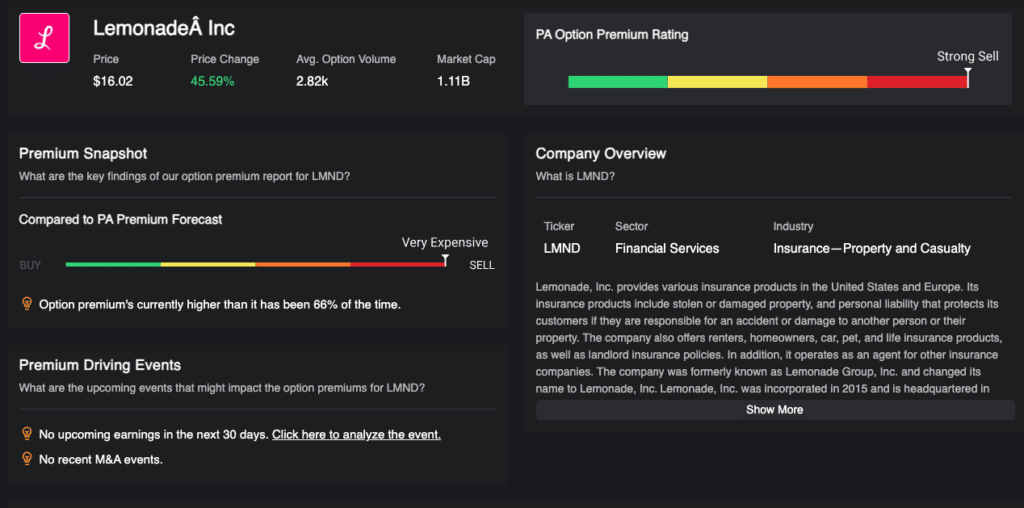
And calculating it’s performance for you!
The reason it’s extremely valuable to be able to run backtests is that if we can see that selling options has been profitable historically, we can infer that there is a risk premium that we can capitalize on by repeating that trade in the future.
Get The Key Points To Know If The Recommended Trade Has Been Profitable Historically
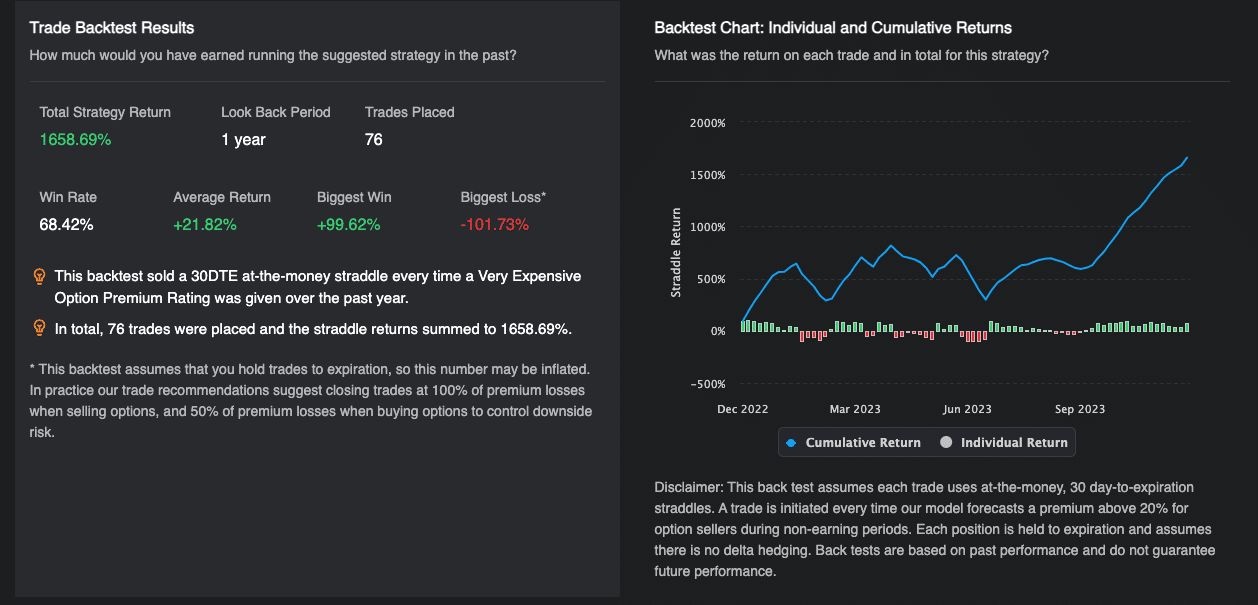
On the left side of every backtest you will see the “Results” section. This shows you the following data:
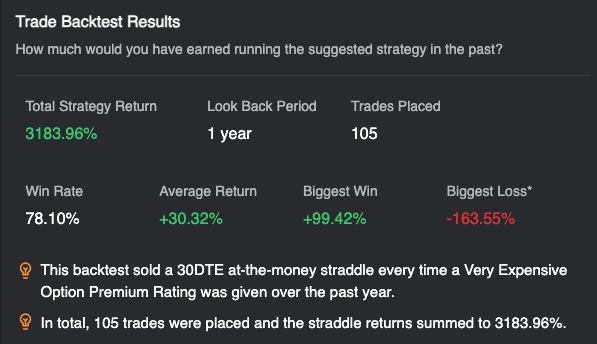
Total Strategy Return
- If you summed up the % return for all of the trades included in the backtest, how much money has this action made or lost? This number tells you!
Look Back Period
- This confirms for you how far into the past the backtest looks. Right now this is standardized to one year.
Trades Placed
- This metric shows you how many times the trade rating the backtest is based on was alerted, and therefore how often a trade was placed over the past year.
Win Rate
- Of the total number of trades placed, what percentage of them resulted in a profitable return?
Average Return
- How much money would you have made or lost taking this trade? This is calculated by taking the total return and dividing it by the number of trades placed.
Biggest Win
- Of all the winning trades, what was the biggest profit generated by a single trade?
Biggest Loss
- Of all the losing trades, what was the biggest loss incurred on a single trade?
- Note: The backtest assumes that you hold trades to expiration, so this number may be inflated. In practice, our trade recommendations suggest closing trades at 100% of premium losses when selling options and 50% of premium losses when buying options to control downside risk.
See The Performance For Yourself
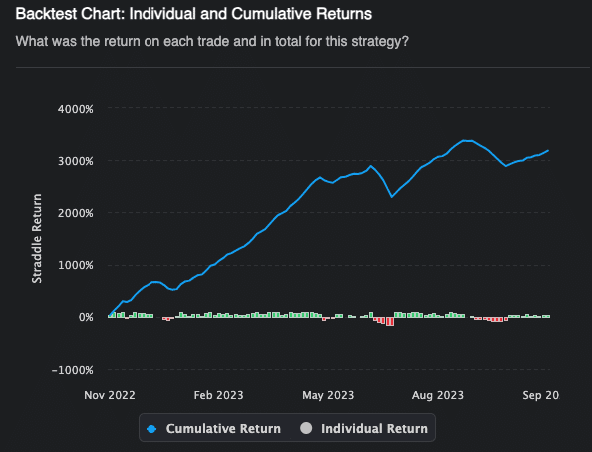
Included in the backtest is a visualization of the performance so that without needing to dive into the statistics you can immediately see the performance, how volatile it has been, and ultimately, whether it is a trade worth taking or not.
You are also able to hover on the chart and for each you will get a full breakdown that tells you everything about that opportunity.
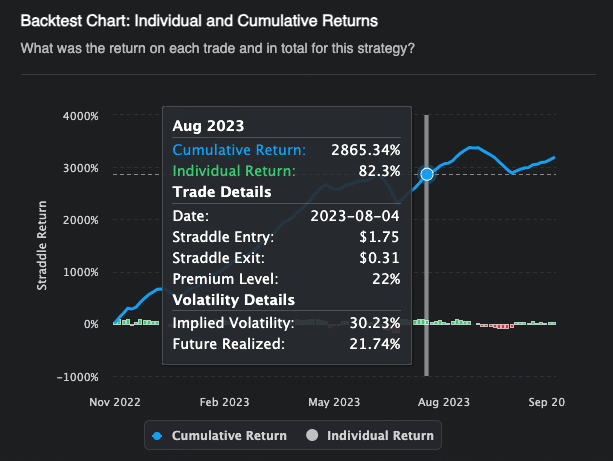
Looking at the picture above you can immediately see how the individual trade performed, the entry and exit prices, the premium level at the time of the trade and a comparison of the implied volatility at that time and the future realized volatility over the next 30 days.
The last section, showing the volatility details is extremely valuable because one of the assumptions of the backtest is that the trade does not do any delta hedging. This means there is some influence on your PnL due to if the stock trends in a single direction. By being able to compare the implied volatility and how much volatility the ticker realized over the next 30 days, you are able to see what is driving your PnL, is it the premium, or is it the stock’s trend? This gives you an extra layer of control over your strategies, something that is very unique to the PA Terminal.
Understanding the Assumptions Behind Our Backtesting Strategy
When conducting backtests, it’s crucial to outline the assumptions made to better understand the context of the results. Here’s a summary of the key assumptions that underpin our backtesting model:
Pricing Model Assumptions:
- Straddle prices are calculated using interpolated values.
- Entry data points are taken approximately 15 minutes before market close, with the strike price equal to the underlying.
- Implied volatility (IV) is based on 30-day metrics.
- Days to expiration (DTE) are set at 30 days, with an interest rate of 5% and a dividend yield of 0%.
Exit Strategy:
- The exit price of a straddle is determined with the underlying price 30 calendar days from the entry date.
Trading Signal Assumptions:
- A new position is conceptualized daily, reflecting a time series of 30-DTE straddle returns.
- The premium report filters for days matching signal criteria based on the IV/FV ratio.
- Our signal strength is categorized as follows:
- Strong Buy: Ratio ≤ 0.8
- Buy: Ratio ≤ 0.9
- Sell: Ratio ≥ 1.1
- Strong Sell: Ratio ≥ 1.2
- There is no backtest for neutral signals, and buy/sell signals include their respective stronger counterparts.
Filtering Parameters:
- Earnings periods and stock splits are excluded.
- The data encompasses the past year, excluding the last 30 days from the report view.
Position Management:
- The strategy involves holding the straddle until expiration without managing the Greeks, which means no adjustments for delta hedging or volatility discrepancies.
Risk and Return Calculation:
- There is no consideration for stop losses or managing positions exceeding a -100% loss.
- Returns are calculated using the formula (straddle exit / straddle entry) – 1, adjusted for position orientation (long or short).
Backtest Limitations:
- Transaction fees and slippage are not factored into the model.
- Cumulative returns may be overstated since multiple entries could be based on the same practical straddle.
Dynamic Updating:
- The backtest is updated daily, adjusting pre-filters according to the current premium ratings.
Backtest Display Information:
- Cumulative Return: The aggregate of all straddle returns up to the selected period.
- Individual Return: The return of a 30-DTE straddle taken on that specific day.
- Trade Details: Include date, straddle entry price, straddle exit price, and the premium level of the day.
- Volatility Details: Display the implied volatility at entry and the approximated future realized volatility.
These assumptions serve as the foundation for our backtesting methodology, shaping the insights and conclusions drawn from our analysis. By acknowledging these parameters, we can better interpret the performance metrics and refine our investment strategies accordingly.
With the completion of our backtest feature we are happy to say that the Predicting Alpha terminal can effectively help you navigate the entire trading lifecycle, going from Search, to Analyze, to Execute, to Manage.
If you have any questions, feel free to send us an email or reach out to us in the Discord Community Chat.
Happy Trading,
Sean & The PA Team