

A while ago, we interviewed MIT researcher Tim De Silva, who found that selling options after an earnings event tends to make money, because IV crush takes some time to materialize fully. Since BABA had just released earnings this morning, this stock is definitely one where we might be interested in selling vol.
Before we do though, we can take a look at the data and see how big our edge might be. We can do that be comparing implied volatility to our own forecast of what realized volatility should be.
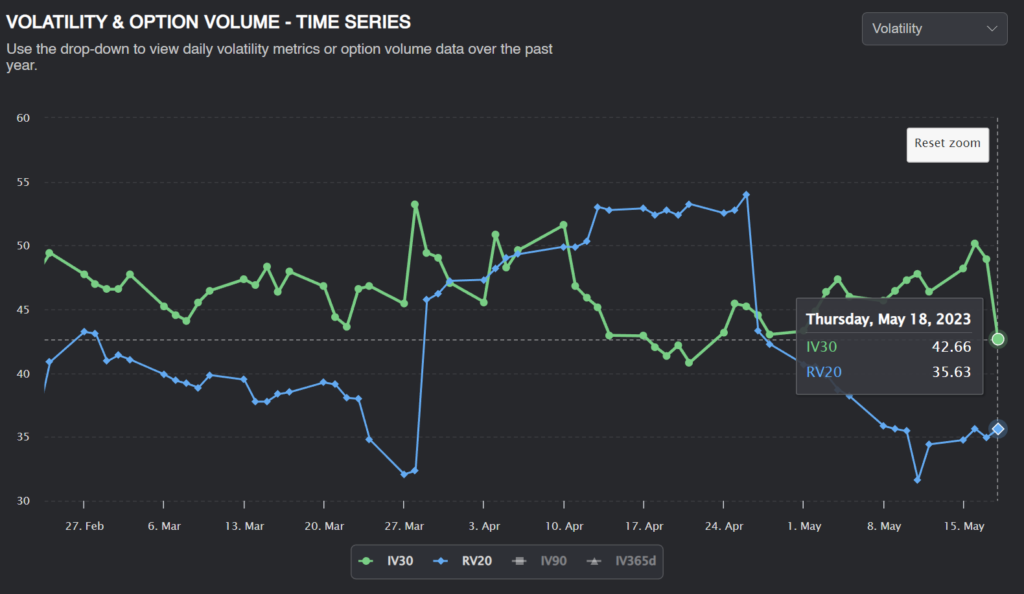
The first thing we can notice from the graph is that volatility has been flat for the last several months. Implied volatility sat at the 45 level, and realized volatility was 40% for the most part, aside from the volatility in early April due to Alibaba’s announcement of their plan to break up the company. Interestingly, the stock price increased after this news.
Options previously implied a 6.5% move on earnings day, but the stock closed down only 5.4% today. After yesterday’s announcement, implied volatility dropped from 50+ to 42.66. Realized volatility, on the other hand, remained at 35.64.
The first thing we can do to forecast BABA volatility is to look at historical data. We can find three similar forecasts of volatility here:
Predicting Alpha Volatility Forecast
The Predicting Alpha terminal forecasts volatility using a blend of IVs and RVs. This is a quick and easy way for volatility traders to understand where implied volatility should be trading. For BABA, the PA forecast is 31.32%.
Realized Volatility
Another estimate for future volatility is simply using the 30-day realized volatility. Since volatility tends to cluster, historical volatility tends to be a good estimator of future volatility. The 30-day window ensures we have enough data without using old, irrelevant data. For BABA, the 30D realized volatility is 35.63%.
Implied Volatility
Since implied volatility is the market’s expectation of future volatility, implied volatility can be a good predictor of future volatility. However, the variance risk premium means implied volatility is typically higher than realized volatility. This is the case with BABA; on average, IV is about 1.075x RV:
By removing the variance risk premium, we can find our third forecast of volatility: 39.68%.
Relative Value Analysis
While we’ve seen that BABA implied volatility looks high relative to historical volatility, we can go one step further and compare the implied volatility of BABA to options prices of similar, correlated companies.
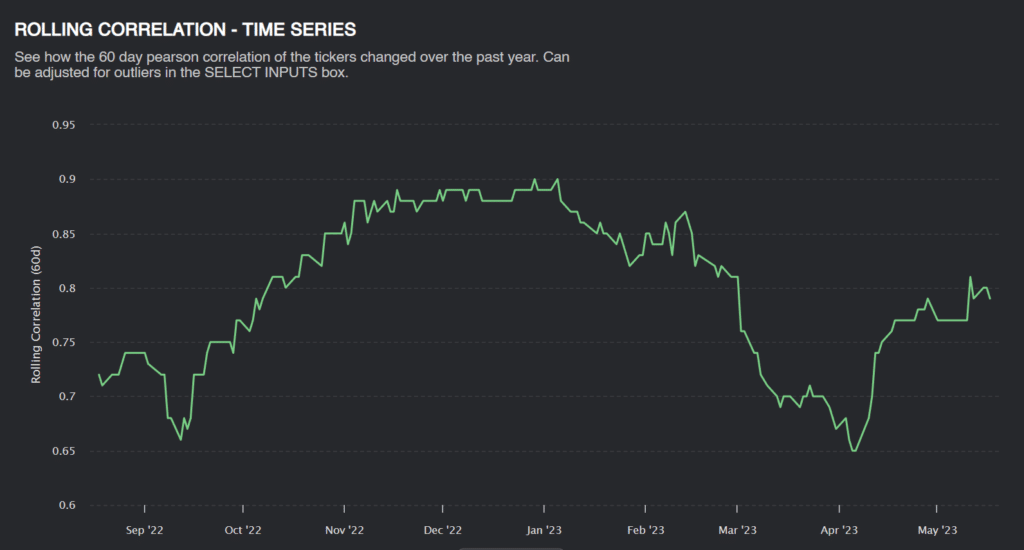
A quick check shows that JD—the Chinese e-commerce company— has a fairly decent correlation to BABA, with a correlation typically greater than 70%.
Since these are correlated tickers in the same industry, it makes sense for the two stocks to have similar IV/RV ratios. Any upcoming catalyst would likely affect both real estate stocks, which would then be priced into implied volatility of both stocks. If we see that the IV/RV ratios of the two stocks are significantly different, this will help confirm that we have a trade opportunity.
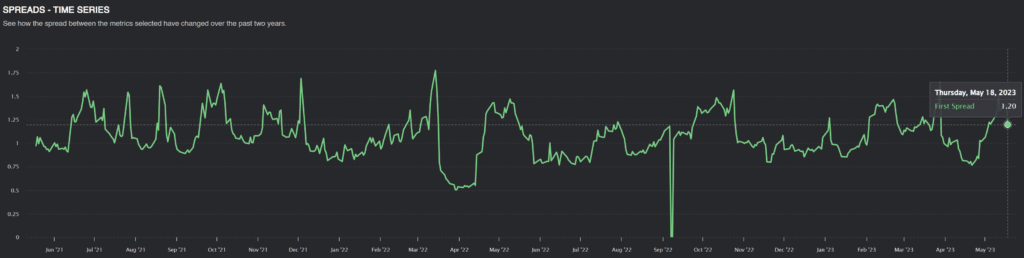
Plotting IV/RV Ratios
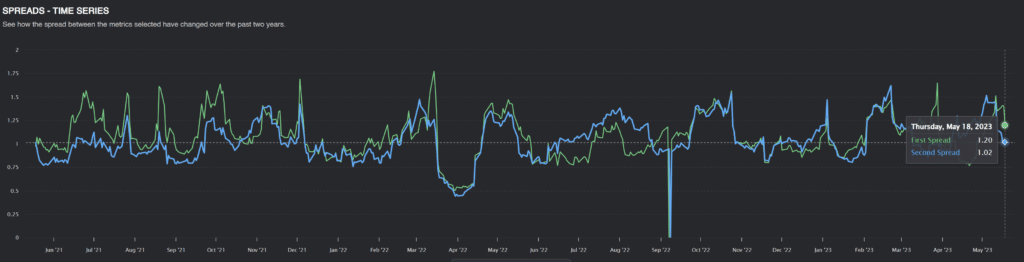
Recently, we see that BABA’s IV/RV ratio is quite higher than JD’s.
While BABA does have upcoming spin-offs, this should, for the most part, be priced into the equity markets and shouldn’t move the stock anymore. While this can contribute to why IV is elevated for BABA, there is probably a risk premium embedded in options. Even the original announcement failed to bring realized vols above 55%.
Assuming no other catalysts exist for BABA, we could try to price BABA volatility relative to JD volatility.
If BABA had the same IV/RV ratio as JD (1.02), realized volatility would have to be 41.8%.
Forecasting Volatility
From our research, SLG options are likely overpriced. As good traders, though, we want to price these options and quantify how large our edge is.
I will do this by taking an average of all our estimates:
- PA Vol forecast: 31.32%.
- Realized volatility: 35.63%.
- Average IV/RV Adjusted RV: 39.68%
- SLG IV/RV Adjusted RV: 41.8%
The average of all 4 estimates is 37.1%.
Given this forecast of volatility, Given this forecast of volatility, here is the current price of the straddle and the “fair value” given our volatility forecast.
The June $85 Monthly Straddle should cost $8.2 as of the close on May 18.
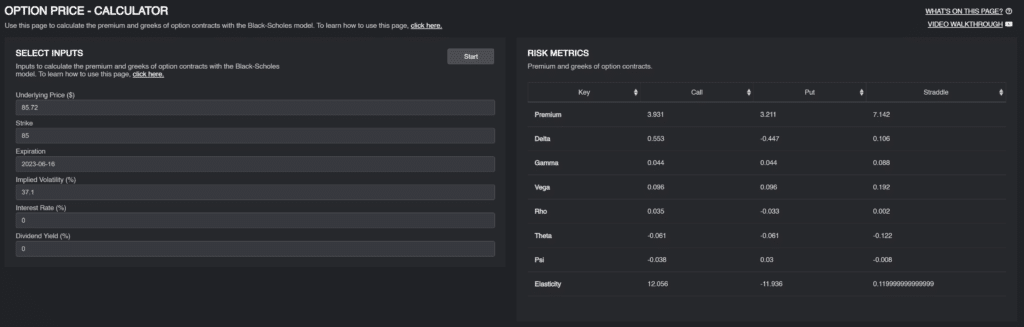
If we estimate the price of the straddle at a 37.1% implied volatility, the straddle should only be worth $7.14! This is just over $100 of edge. Assuming it costs $5000 in margin to sell the straddle, that’s a monthly return of 2%.
Position Sizing and Management.
For a trade like this, I am not looking to load the boat on it. This is just another part of a short volatility book, but with some good research to back it ( when you build a book of trades like this, you do pretty well).
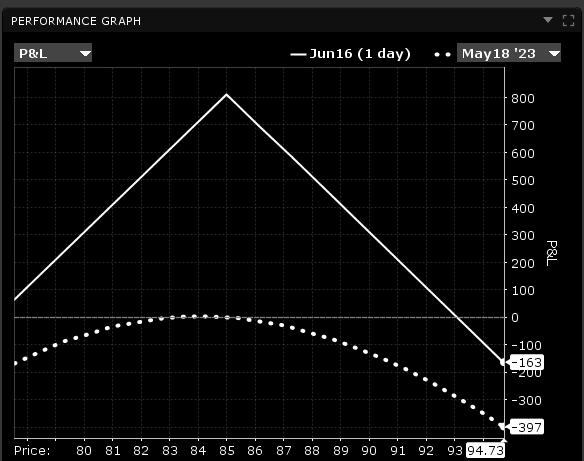
Stressing the position to an arbitrary 10% move in spot price results in a $400 dollar loss. I feel comfortable placing this trade, knowing that even a large move like this shouldn’t impact my portfolio too much.
As for position management, I would continue to hold this trade if BABA realizes less volatility than implied. If we start to see multiple days in a row of outsized moves, I will cut the position early, even at a loss. Of course, if implied volatility drops, we can get out once the edge is gone.
Conclusion
I want to reiterate that this is just one of many trades that should be a part of a short-vol book. The research is solid, but the edge that it gives us is not enough for “Let’s yolo our life savings.”
So trade it small; find many similar trades to spread your risk!
Good luck, and happy trading.