

During my daily options scan, I found a trade that should return 2% on your margin this month.
Here is my analysis.
What is EWT?
EWT tracks the investment results of an index composed of Taiwanese equities. Here’s how the price has moved recently:
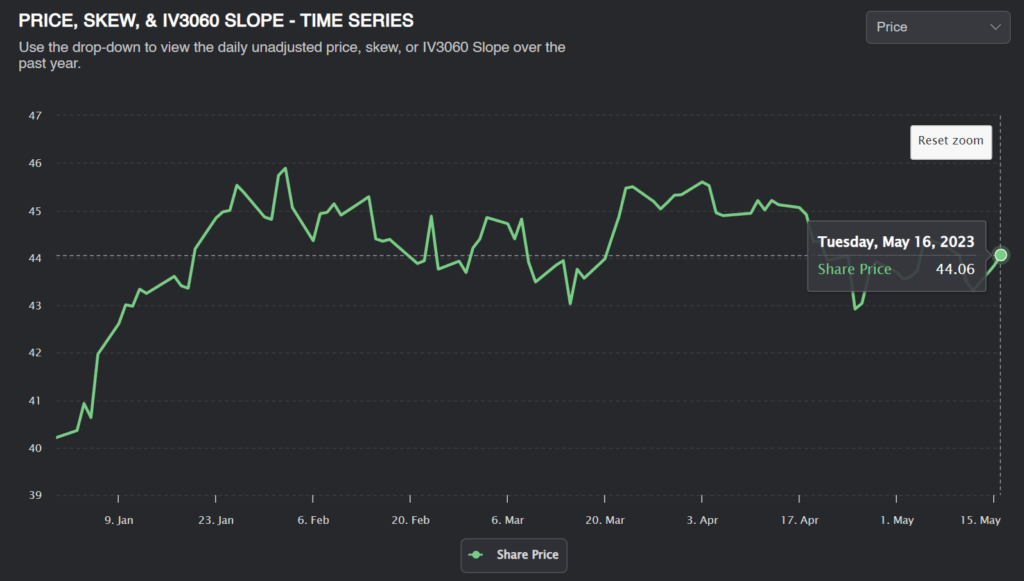
While we saw a bit an extended run in early January, the stock has since stayed flat, fluctuating gently between $43 and $46. We’re in the middle of that range right now.
Here is EWT’s holdings:
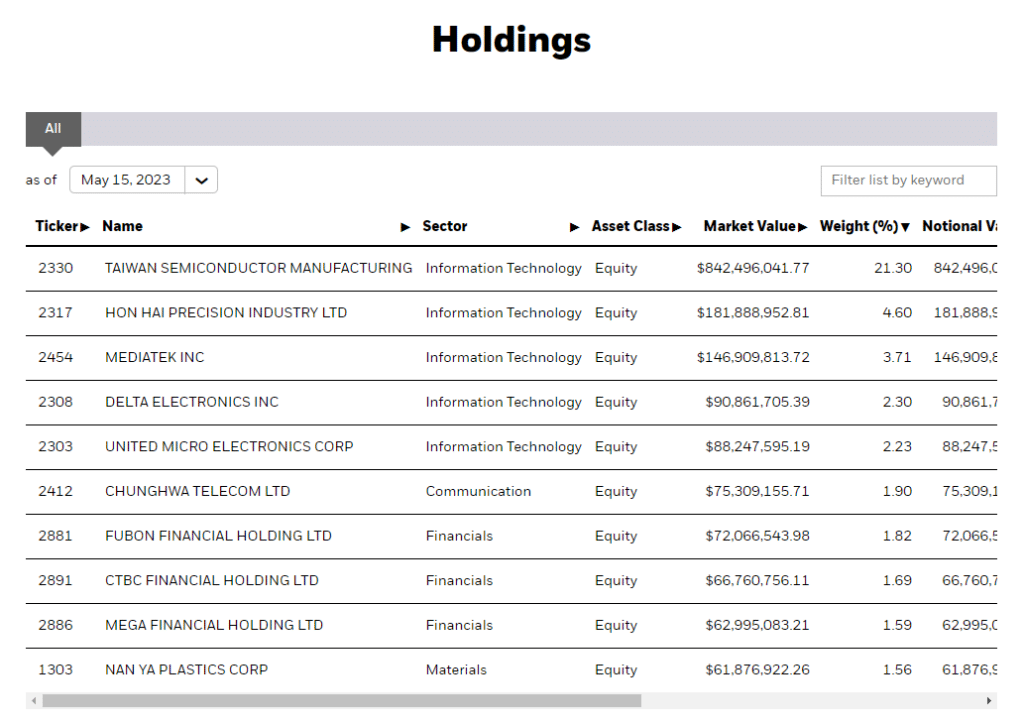
The biggest stock, TSMC, Makes up over 20% of the index. The other holdings are all less than 5% of the ETF.
Historical Vol for EWT
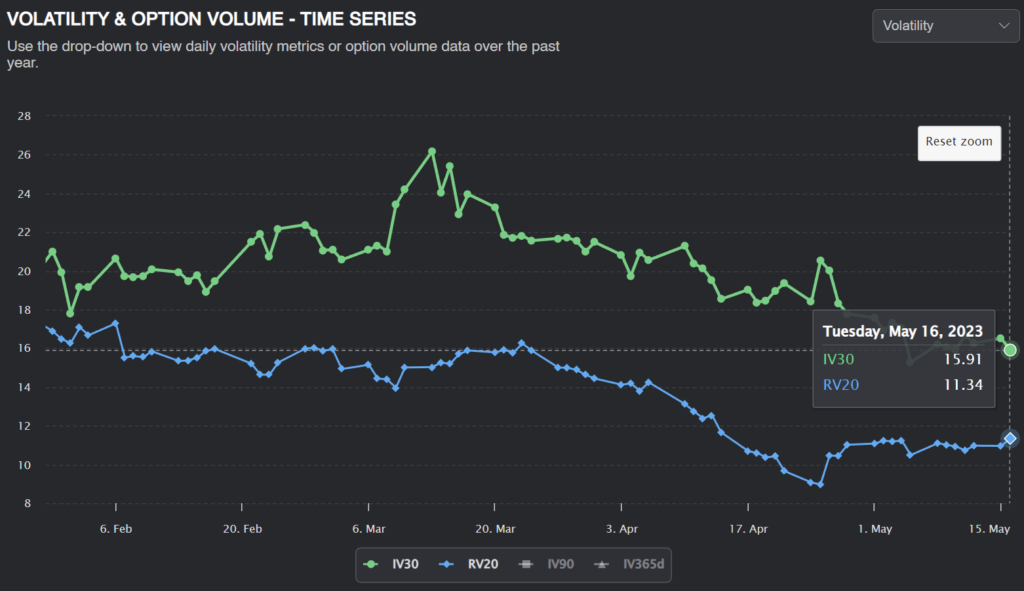
The implied volatility graph is where things get interesting. For the last several months, there has been quite a significant volatility risk premium on EWT. This might be a good option selling opportunity.
Building A Vol Forecast: Absolute Valuation
The first thing we can do to forecast EWT volatility is to look at historical data. We can find three similar forecasts of volatility here:
Predicting Alpha Volatility Forecast
The Predicting Alpha terminal forecasts volatility using a blend of IVs and RVs. This is a quick and easy way for volatility traders to get a sense of where implied volatility should be trading. For EWT, the PA forecast is 12.73%.
Realized Volatility
Another estimate for future volatility is simply using the 30-day realized volatility. Since volatility tends to cluster, historical volatility tends to be a good estimator of future volatility. The 30-day window ensures we have enough data without using old, irrelevant data. For EWT, the 30D realized volatility is 11.34%.
Implied Volatility
Since implied volatility is the market’s expectation of future volatility, implied volatility can be a good predictor of future volatility. However, the variance risk premium means that implied volatility is typically higher than realized volatility. This is the case with EWT, as we can see that on average, EWT IV is about 1.5x RV:
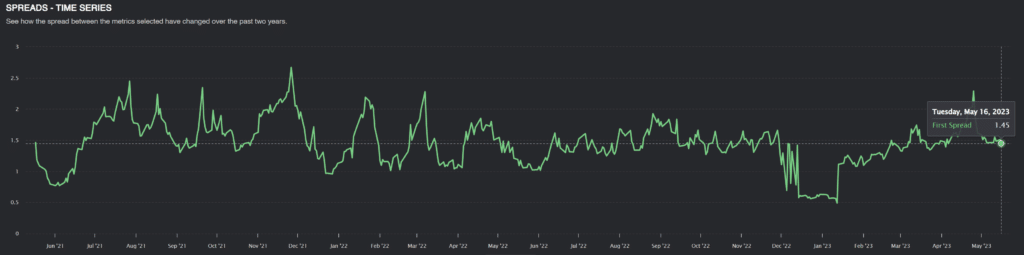
The average premium for EWT is 45%. By removing the variance risk premium, we can find our third forecast of volatility: 11.21%.
Relative Valuation
We can examine the implied volatility of a similar, correlated ticker to determine whether EWT implied volatility is overpriced. Because the biggest holding of EWT is a semiconductor stock, it makes sense that SMH, a semiconductor ETF, is quite correlated with EWT.
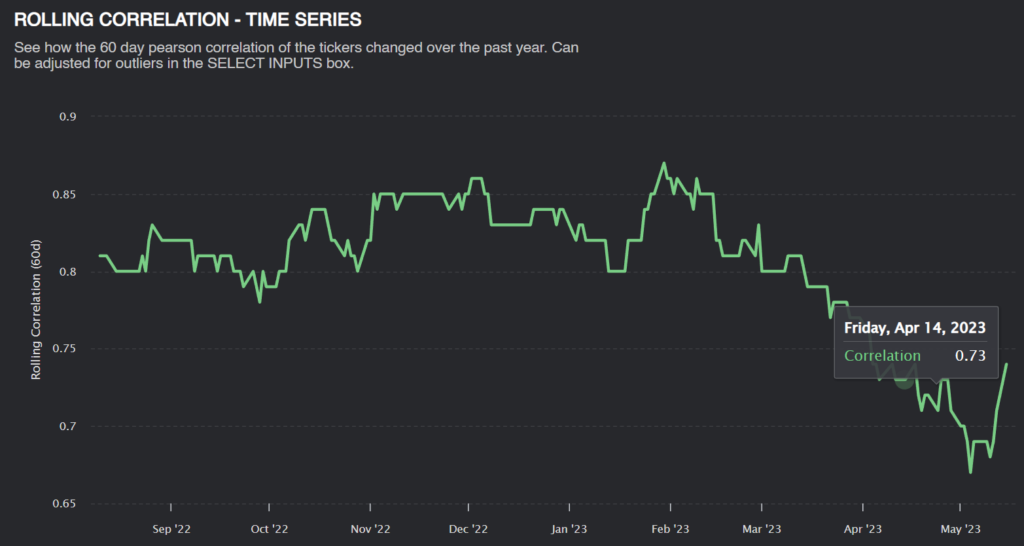
The correlation of the two stocks is bout 73%, but typically is closer to the 80% range.
Similar stocks should have similar risk premiums, since upcoming catalysts that affect one should affect the other. If EWT’s premium is significantly different than SMH, that might indicate a trade opportunity.
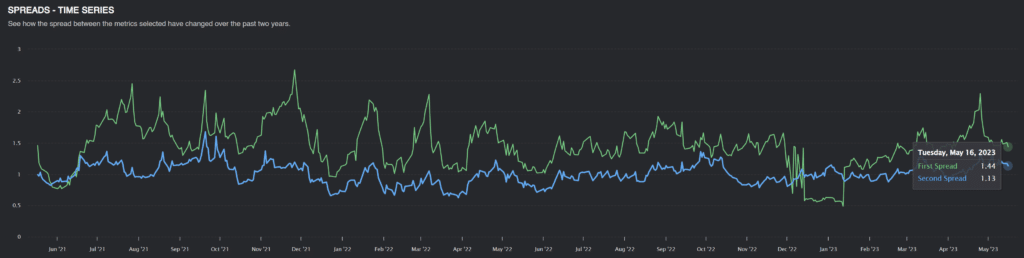
The IV/RV Ratio graphs tell us that EWT (Green) has a significant vol premium compared to SMH (Blue).
We see similar patterns in the vol premium for both stocks, but EWT volatility is almost always overpriced compared to SMH. This could be due to several reasons:
Geopolitical Risk
EWT is a Taiwanese ETF. Considering it’s frosty relations with China, there could be geopolitical risks that affect EWT much more than SMH. This could explain part of EWT’s vol premium.
Overnight Risk
As a Taiwanese ETF, the underlying stocks move while the US markets are closed. This creates a risk that can’t be hedged. Option sellers may demand a bigger premium for taking on this risk.
Illiquidity Risk
EWT is fairly illiquid, meaning traders can’t enter and exit positions easily. This can also contribute to options sellers demanding a better price.
How Big Is Our Edge?
While we might not be able to compare EWT and SMH directly, we still have our estimates of EWT vol from historical data. An average of the three estimates gives us a forecast of 11.76%, a 4 vol point premium.
The market price of a June $43.81 (an adjustment must have been made for dividends) straddle is around $1.64, but at an 11.76% volatility, we know the straddle should only be worth $1.22. There is approximately $40 of edge per straddle.
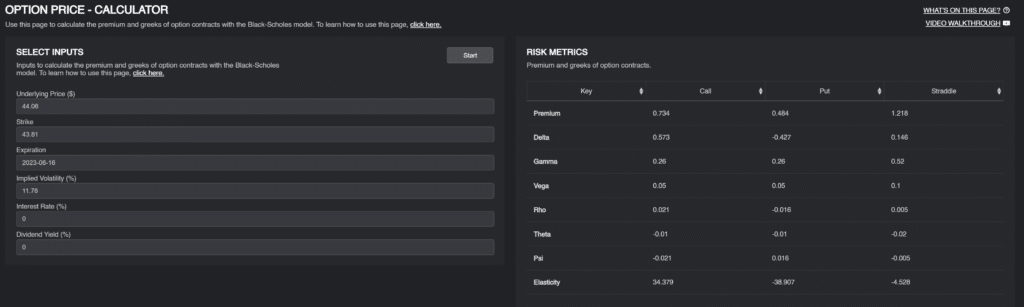
Since the position requires about $2000 in margin, this translates to a 2% return in 31 days. Not bad
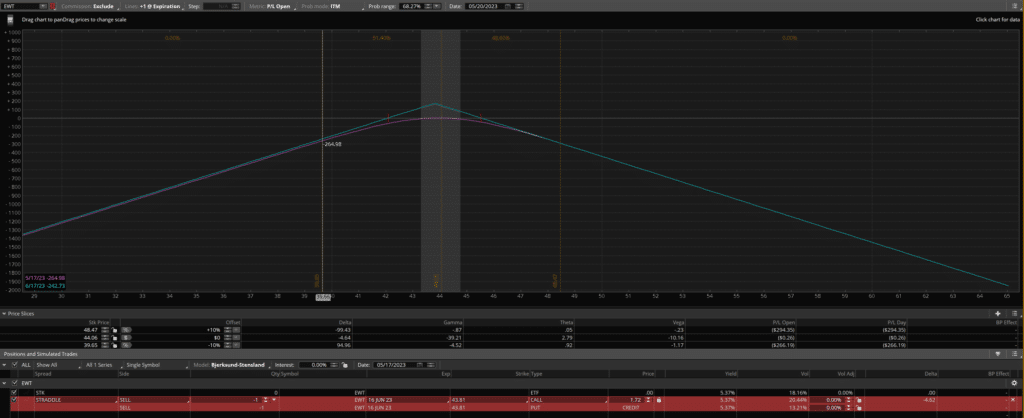
Position Sizing
For a trade like this, I am not looking to load the boat on it. This is just another part of a short volatility book, but with some good research to back it ( when you build a book of trades like this, you do pretty well).
Stressing the position to a 10% move in spot price results in less than a 260 dollar loss. I feel comfortable placing this trade, knowing that even a historic move like this shouldn’t impact my portfolio too much.
As for position management, I would continue to hold this trade if EWT realizes less volatility than implied. If we start to see multiple days in a row of outsized moves, I will cut the position early, even at a loss. Of course, if implied volatility drops, we can get out once the edge is gone.
Conclusion
I want to reiterate that this is just one of many trades that should be a part of a short-vol book. The research is solid, but the edge that it gives us is not enough for “Let’s yolo our life savings.”
So trade it small; find many similar trades to spread your risk!
Good luck, and happy trading.