
I found a trade that should earn a 1.7% return on margin in 11 days.
I first noticed this ETF during my daily expensive options scan. Here’s my analysis of this trade.
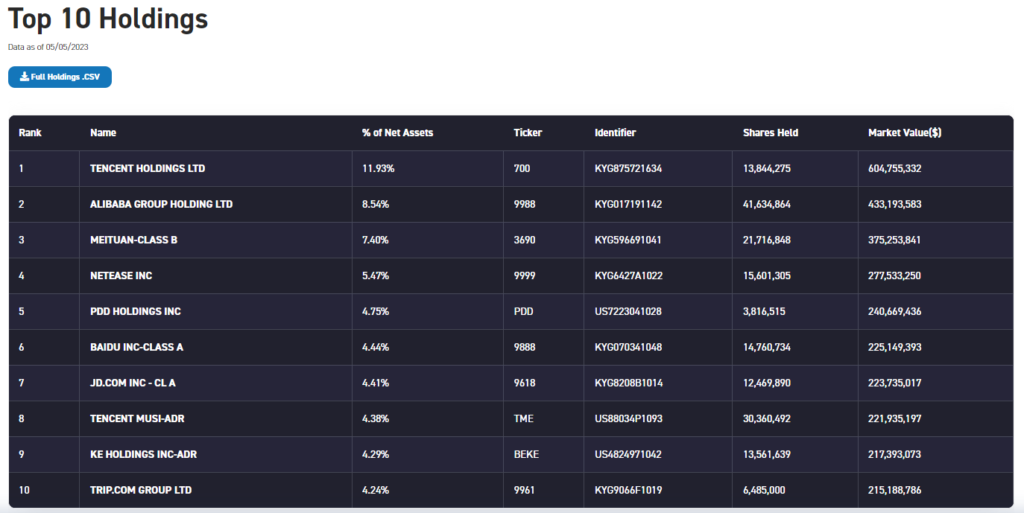
What is KWEB?
KWEB tracks the CSI Overseas China Internet Index. The Index includes publicly traded securities on the Hong Kong Stock Exchange, NASDAQ Stock Market, or New York Stock Exchange.
Top holdings include well-known companies such as Tencent, Alibaba, and Baidu.
Here’s how the ETF has been moving recently:
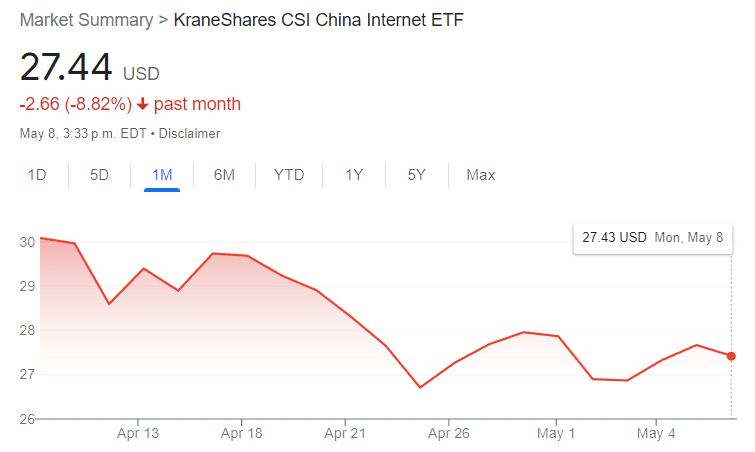
The ETF has been trending downwards, which might motivate options buyers to pick up some puts as insurance.
The options markets imply that KWEB will move 2.6% daily over the next month. However, it’s only been moving around 1.7% daily on average. Even though the total move downward over the last month has been sizable, daily volatility has been fairly low.
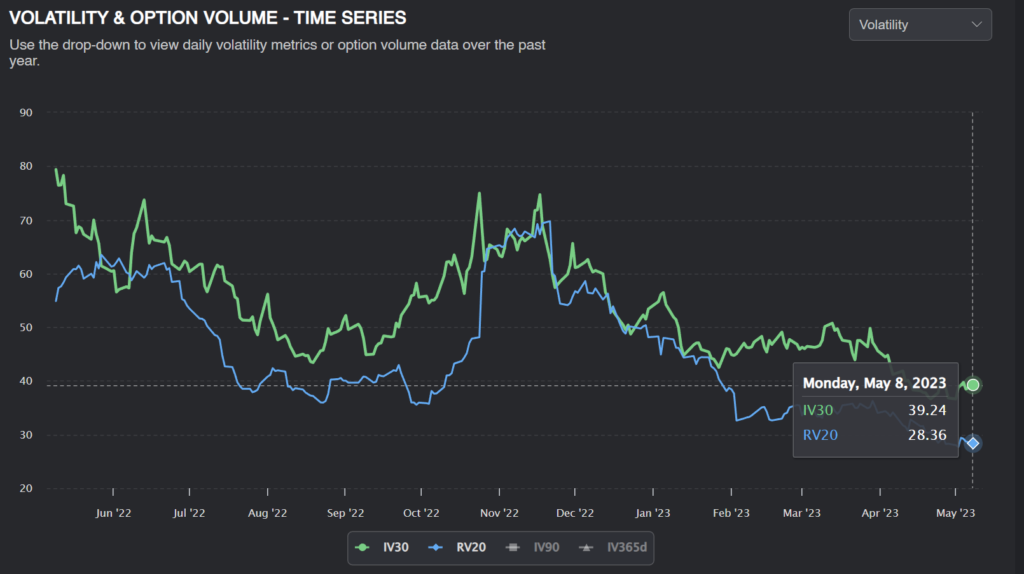
Looking at our volatility graph, we can see that implied volatility has been significantly higher than realized volatility since February! Options traders are bidding up the price of options, but the stock isn’t moving around all that much.
This seems like a great opportunity to sell some overpriced options.
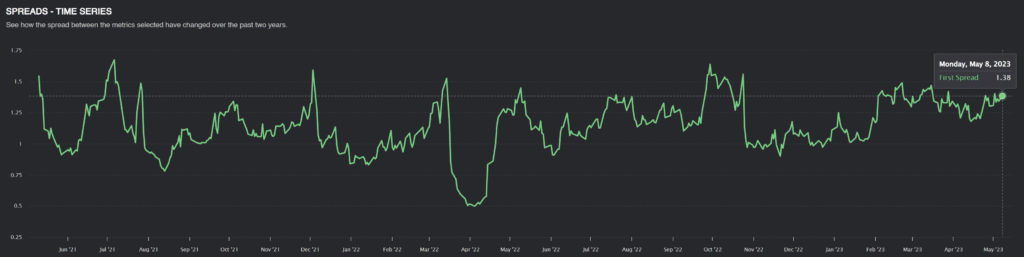
This is the IV/RV ratio for KWEB. When the IV/RV ratio is greater than 1, options are expensive, and there is a risk premium. For KWEB, there seems to be a large, consistent premium for option sellers.
A Quick Recap:
- KWEB shows up in my expensive vol scan
- Stock falling might explain option demand
- KWEB options have consistently been overpriced
Before we place our trade, though, we can do further analysis.
We’ve seen what KWEB implied volatility looks like compared to its past volatility, but we can also compare KWEB implied volatility to IV of similar ETFs.
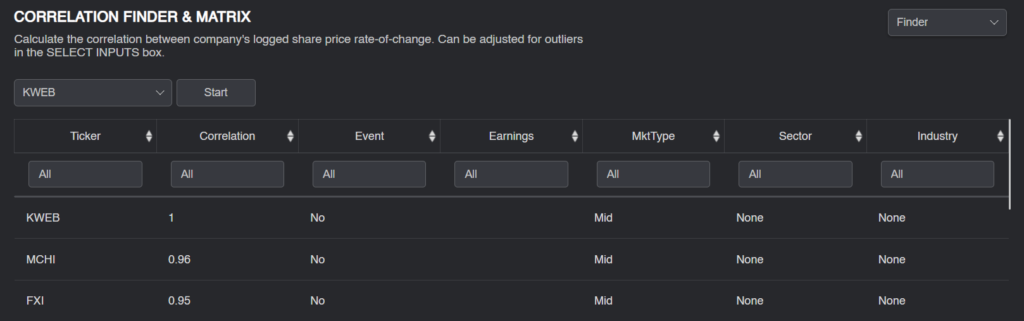
The first thing I notice is how correlated FXI is to KWEB. This makes sense, as they’re both Chinese ETFs. You might similarly expect SPY, QQQ, and DIA to be fairly correlated.
If these stocks are all correlated, it makes sense for implied volatility levels to be similar for all of these ETFs. We can now compare the IV/RV ratios for all of these ETFs and see if any of them have a particularly large premium.
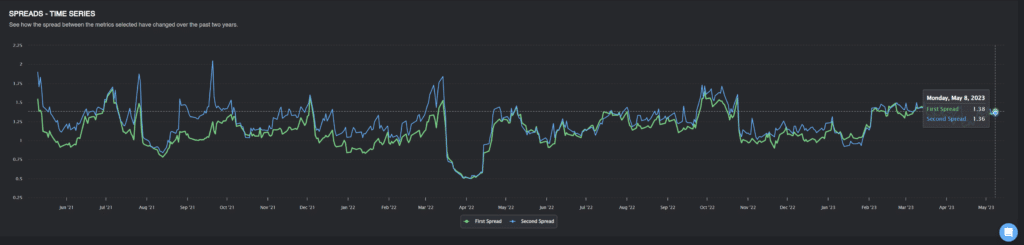
Our graph shows that FXI’s IV/RV Ratio (Blue) tends to be higher than KWEB’s (green) on average. However, the spread has recently converged, and KWEB’s premium is now barely above FXI.
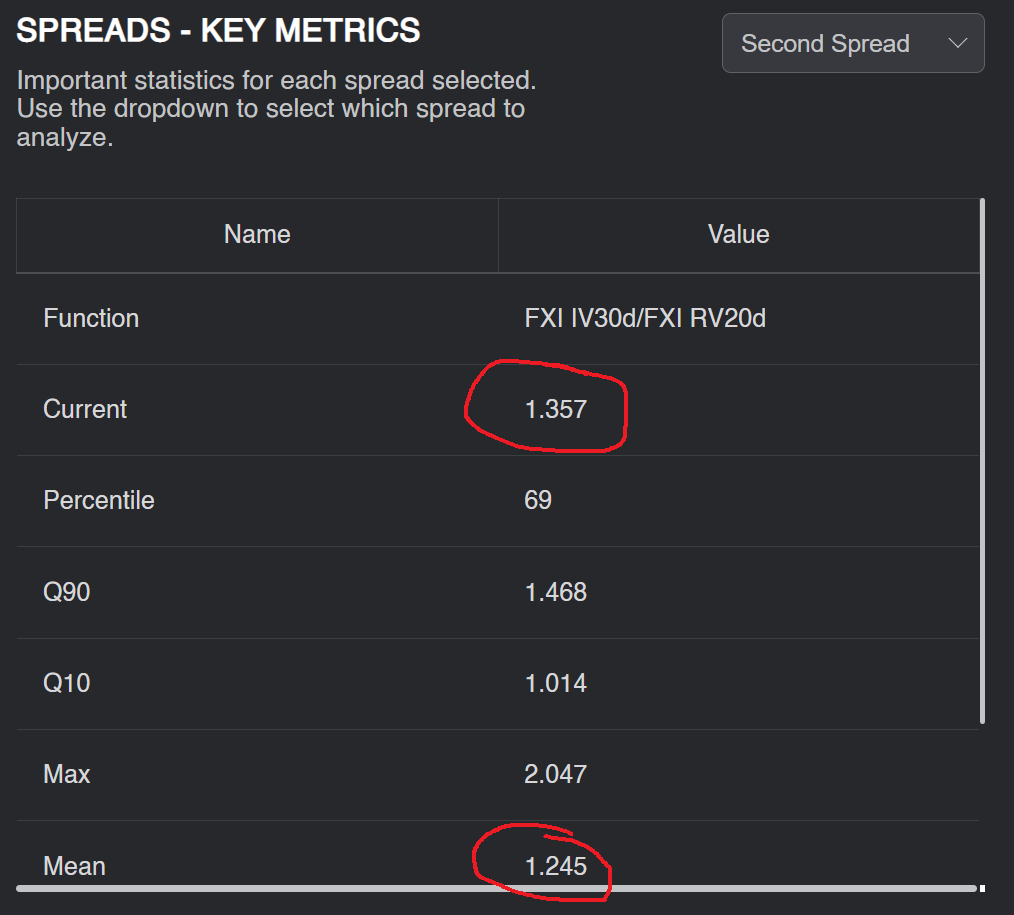
The key metrics tell a similar story. FXI has an average premium of 24.5% but currently has a 35% premium.
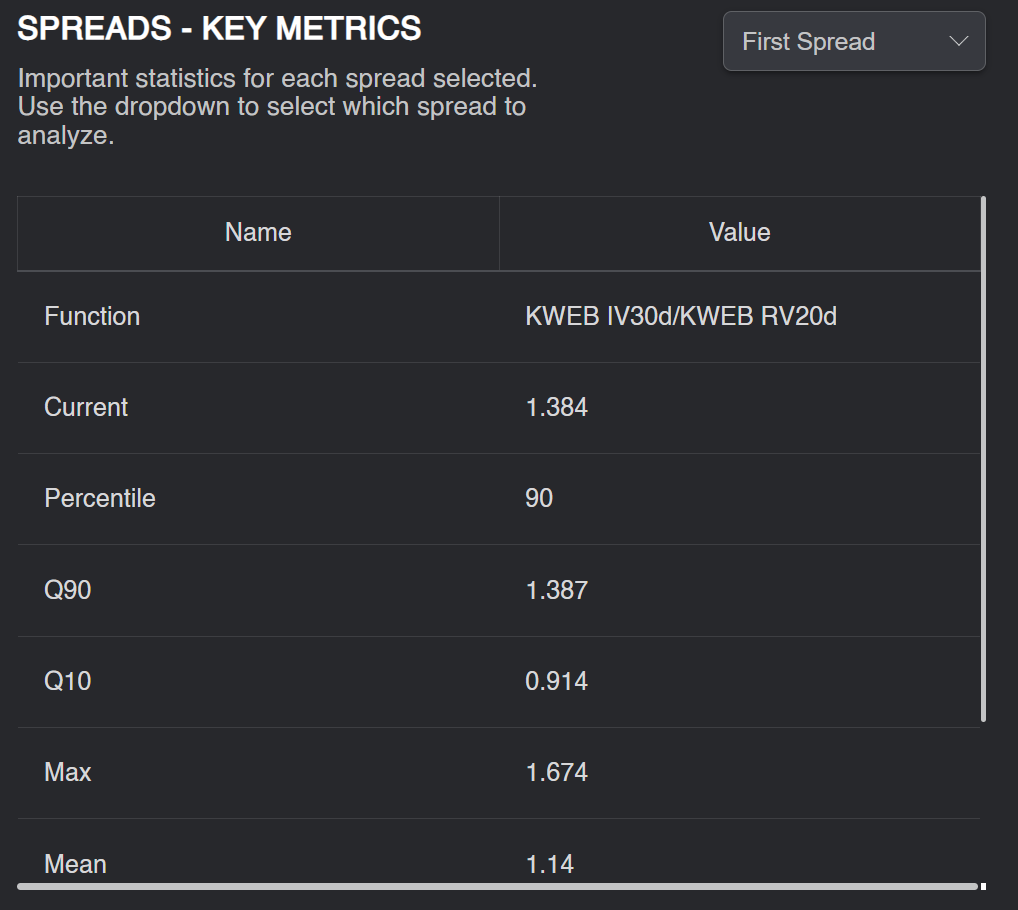
KWEB has a much smaller average premium of 14%. However, KWEB’s current premium is 38.4%!
Looking at historical volatility and FXI’s volatility, we can conclude that KWEB’s premium is too high.
FXI’s premium is 9% above its average. Kweb’s premium is 21% higher! If KWEB’s premium was only 9% above it’s mean, it would be 1.24. Instead, the premium is 1.38.
Forecasting KWEB volatility
We know that options are expensive here, but we also want to be clear on exactly how expensive these options are.
I will do this by taking a blend of 2 things:
- The PA forecast of volatility
- Kweb’s RV if KWEB and FXI’s IV/RV ratios were proportional to each other.
PA Forecast: 27.28%
RV of KWEB at a 1.24 IV/RV: 31.6%
Given this forecast of volatility, here is the current price of the at the money straddle and the “fair value” given our forecast of volatility.
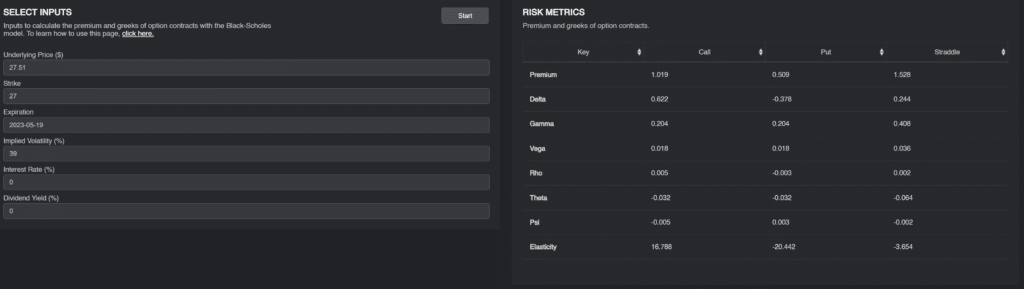
The May $27 straddle costs around $1.53 at a 39% volatility. However, at 31.6%, the straddle should only be worth $1.26!
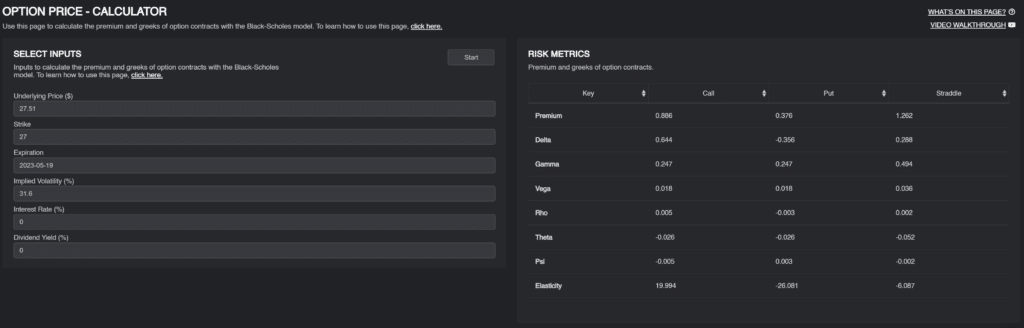
Given that a straddle costs around $1,400 in margin, the ~$25 expected profit is a 1.7% return on margin, over 11 days.
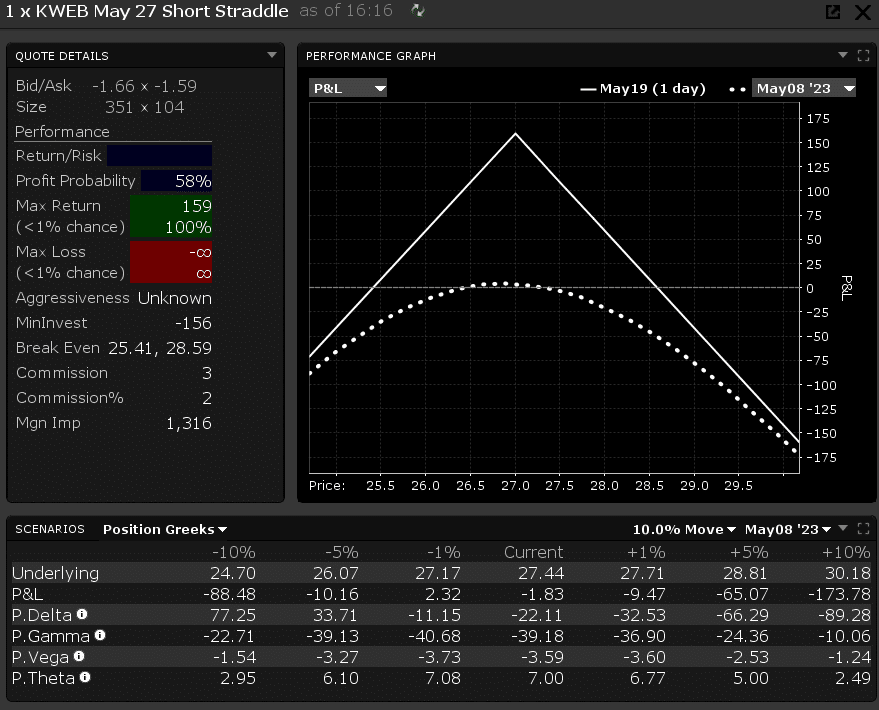
We could put on a trade that looks something like this:
Position Sizing and Management.
For a trade like this, I am not looking to load the boat on it. This is just another part of a short volatility book, but with some good research to back it ( when you build a book of trades like this, you do pretty well). So I would be sizing this relatively small and stressing this position to a 1.5x straddle price move. I would use that as my max loss scenario where I would certainly be looking to cut the trade.
I am comfortable using this because KWEB is an ETF, so we don’t carry the same “blow-up risk” as single-name trades.
As for position management, I would continue to hold this trade if KWEB realizes less volatility than implied. If we start to see multiple days in a row of outsized moves, I would cut the position early , even at a loss. Of course, if implied volatility drops, we can get out once the edge is gone.
Conclusion
I want to reiterate that this is just one of many trades that should be a part of a short vol book. The research is solid, but the edge that it gives us is not enough for “Let’s yolo our life savings”.
So trade it small, find many similar trades to spread your risk!
Good luck, and happy trading.