

This is a simple trade that will make around 1% in a month. Here is my research:
What is TSMC?
TSMC is a semiconductor manufacturing company with huge companies such as AMD, Apple, NVIDIA, and more as its clients. Here’s how the stock has been moving recently:
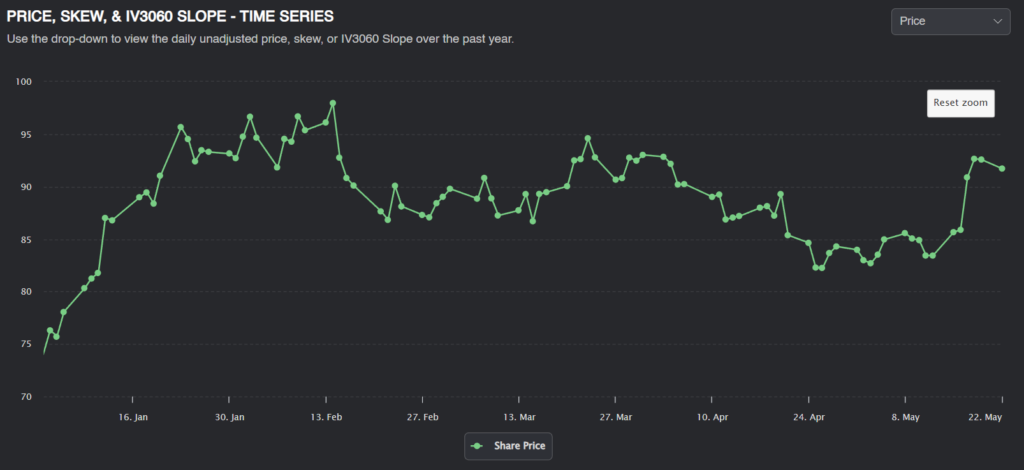
While the stock made an impressive run in the beginning of the year, it’s calmed down a bit since then. The stock has stayed around the $90-ish mark, ranging from roughly $85 to $95.
The implied volatility of TSM has been pretty high for the last several months. The current implied vol is 27.51, but the realized vol is around 25.03.
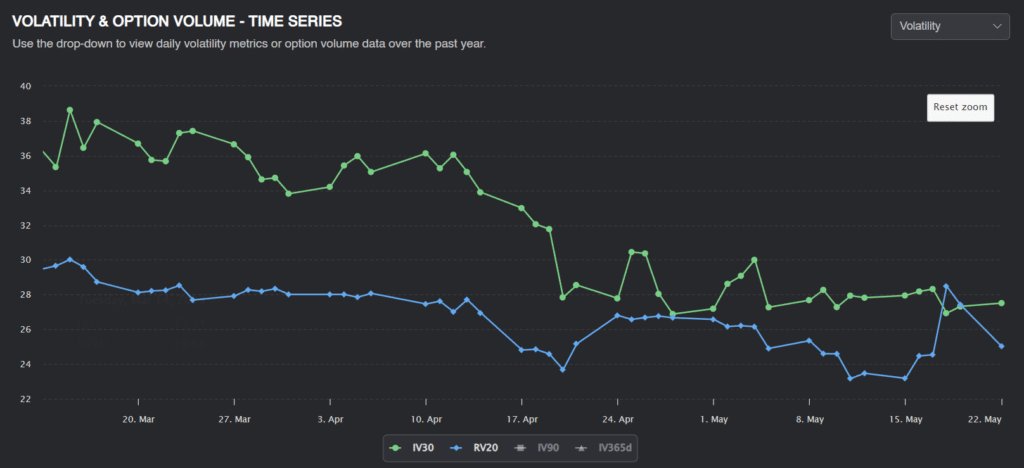
We can see that there’s been a significant premium, and even though the spread is gradually closing, implied volatility remains above realized volatility.
This seems like an attractive stock to sell options on, so what we can do is try to forecast future volatility and determine if we have an edge being short volatility here.
We can use historical data to try and forecast future volatility three different ways:
Predicting Alpha Volatility Forecast
The Predicting Alpha terminal forecasts volatility using a blend of IVs and RVs. This is a quick and easy way for volatility traders to understand where implied volatility should be trading. For TSM, the PA forecast is 22.69%.
Realized Volatility
Another estimate for future volatility is simply using the 30-day realized volatility. Since volatility tends to cluster, historical volatility tends to be a good estimator of future volatility. The 30-day window ensures we have enough data without using old, irrelevant data. For TSM, the 30D realized volatility is 25.03%.
Implied Volatility
Since implied volatility is the market’s expectation of future volatility, implied volatility can be a good predictor of future volatility. Implied volatility tends to be just a tad higher than realized, though, because of the variance risk premium. This is the case with TSM; on average, IV is about 1.06x RV:
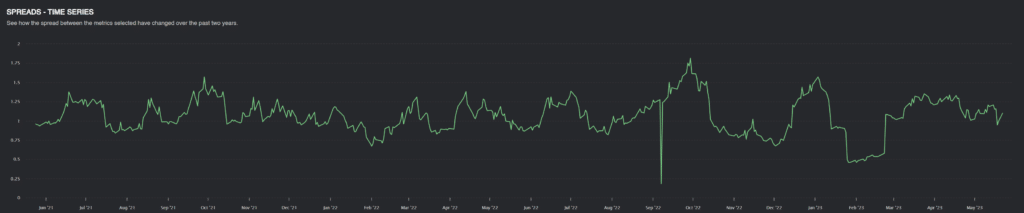
By removing the variance risk premium from implied volatility, we can find our third forecast of volatility: 25.9%.
Forecast of Volatility
By taking an average of our three estimates, we have an average of 24.54%. Compared to our current 27.51 vol, that’s a 3-point difference!
The market price of the $92 June monthly straddle is around 5.28, but at a 24.54 vol, the straddle should be only worth 4.71. By selling the straddle, we make about $57 monthly on less than $5000 in margin.
Position Sizing and Management.
As for position management, I would continue to hold this trade if TSM realizes less volatility than implied. If we start to see multiple days in a row of outsized moves, I will cut the position early, even at a loss. Of course, if implied volatility drops, we can get out once the edge is gone.
Conclusion
This is just one of many trades that should be a part of a short-vol book. The research is solid, but the edge isn’t enough to YOLO our life savings.
Trade it small; find many similar trades to spread your risk!
Good luck, and happy trading.