For a long time there was a big edge in putting together your own model for volatility and trading when it was different from the market.
But in recent years, the market has become a lot better at forecasting volatility. The odds of us putting together a vol targeting forecast that beats the market on average across a large array of tickers is pretty low. Not because forecasting has become hard, but because when you make a good forecast it gives you a similar number to the implied volatility from the market. But the beauty in volatility trading is that you don’t need to be able to see the future. There is plenty of cash on the table for simply being able to measure the present accurately.
Measure, Don’t Forecast.
Since volatility is stationary we can tell when it’s high and when it’s low. We can see where it should be on average and use this to build a book based on harvesting the richest premiums. With pieces of information like this, we can build really good systems that allow us to monetize volatility trading strategies without needing to see the future. This is the foundation of volatility trading in the modern age.
Calculating The Variance Risk Premium
One of the most powerful functions of the Predicting Alpha terminal is that it calculates the variance risk premium for you. In order to calculate the variance risk premium for a ticker, we need to do a couple of things.
- We need to compare the market forecast of volatility for a time period against the realized volatility experienced in that same time period. This will tell us the premium that was embedded on a given day. We use the IV30d and the subsequent realized volatility over the next 30 days.
But simply seeing this for one day isn’t enough for us to make a trade. A single day tells us if there was a profitable trade, but it doesn’t tell us if there is an embedded premium for us to monetize. To know this, we have one more step to take.
- We run this calculation for every single day over a large time period and use it to build a chart of the variance risk premium.
- It allows us to see if there is a persistent effect that we can monetize. This persistent effect is what we call the variance risk premium.
This is the calculation that is run for each day. It allows us to measure the 1 day premium (how much higher was implied volatility than realized?).
But in order to determine if this is a tradable effect rather than a one off scenario, we need to extend our analysis. Instead of calculating the premium for just a single day, we will do it daily over a span of four years. This approach will allow us to assess the persistence and magnitude of the effect over a more extended period.
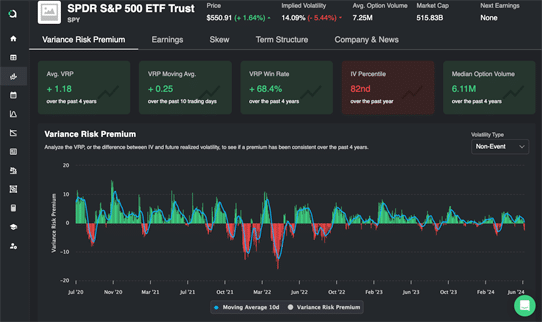
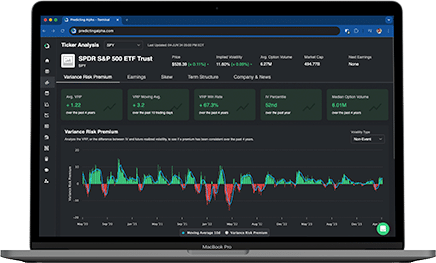
At Predicting Alpha we handle this for traders by creating a 4 year analysis of the Variance Risk Premium for every ticker. This is seen on the Variance Risk Premium Page on the main chart (see below). Each bar represents the premium for a single day, and overlaid is the moving average for the premium.
Alright, so this graph is awesome. It literally shows me the risk premium over time for any asset. But what are the important insights?
Key Insights From The Variance Risk Premium
At a fundamental level, there are 5 metrics which can paint a clear picture of the option premium landscape. Each of these is available to you in the Variance Risk Premium Dashboard.
At a glance you can measure the size of a risk premium for an asset. Pretty cool, huh?
This is the foundation that option sellers use to run a profitable portfolio.
- We know that there is a risk premium embedded into the price of options
- We know that volatility is stationary and that we can measure it
- By calculating the average embedded risk premium over long periods of time we are able to determine if options for a ticker are a net sell or not.
- By using support metrics like the IV Percentile, VRP Win rate, and VRP moving average we can determine if we should be including a ticker in our portfolio today.

