
Introduction:
Within the PA Terminal you are able to filter the market using over 150 metrics. Each metric is option trading specific and it allows you to explore every corner of the market. And THAT is how you find real alpha.
Here’s an example of a scan that I built this week which I have used to find multiple profitable trades already.
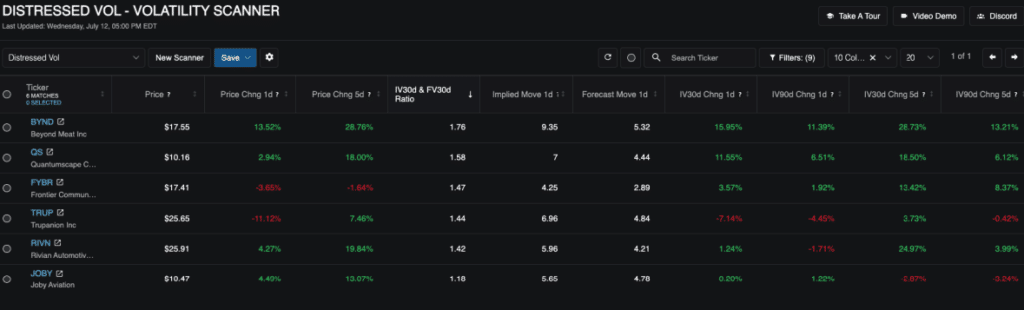
I call it my “Distressed Volatility” scan, and it generates a list of tickers who have their entire term structure IVs above the 70th percentile (for all expirations).
This scan shows me tickers who have their entire term structure elevated, indicating to me that there has been a major news release or impact the the stock that is causing volatility to have a massive risk premium.
This is just one example over the hundreds of potential scanners you can build using the PA terminal, and the types of opportunities it can help you monetize.
Now let’s talk about how you can build your own.
NOTE: I worked with the PA community members every day to build out scans in our Discord Community. When you start a free trial, make sure to join our private community so we can set up scans that are optimal for your current strategies.
When you want to build your own scanners there is a very simple process you can follow:
- Click New Scanner and pick a name for it
- Set the filters you would like to use in your scan
- Set the columns you would like to see on your scanner
- Save your scanner
That’s it! Every time you sign into the PA terminal your scan will be ready and available for you to use.
Note: You have the ability to save up to 25 custom scans.
Now let’s break down the 4 steps to building your own scans!
Step 1: Click “New Scanner” and pick a name for it
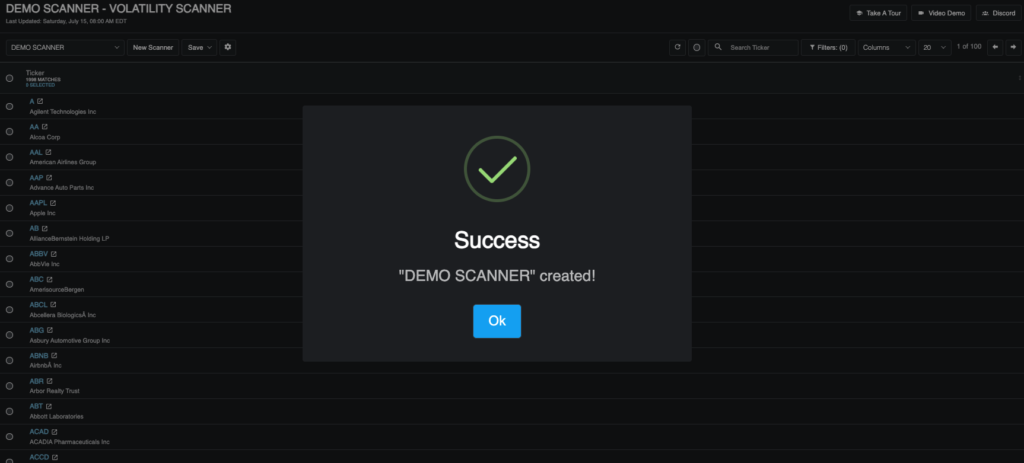
To get started, click the new scanner button in the top left corner of the scanner. This will open up a dialogue box for you that will ask you to pick a name for the scanner. Type in the name you want and click “Create”!
And there you have it! A new blank scanner has been created!
Step 2: Set the filters you would like to use in your scan
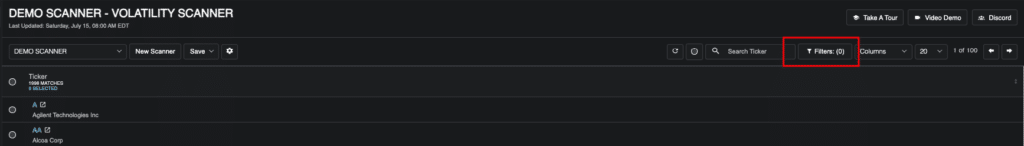
In order to set the filters or search criteria that you would like to use, all you need to do is open the filters window by clicking the button labelled “filters” in the top right corner of the scanner.
What filters are available?
Note: for an explanation of what each data point is, you can hover over the tool tip beside the data point name.
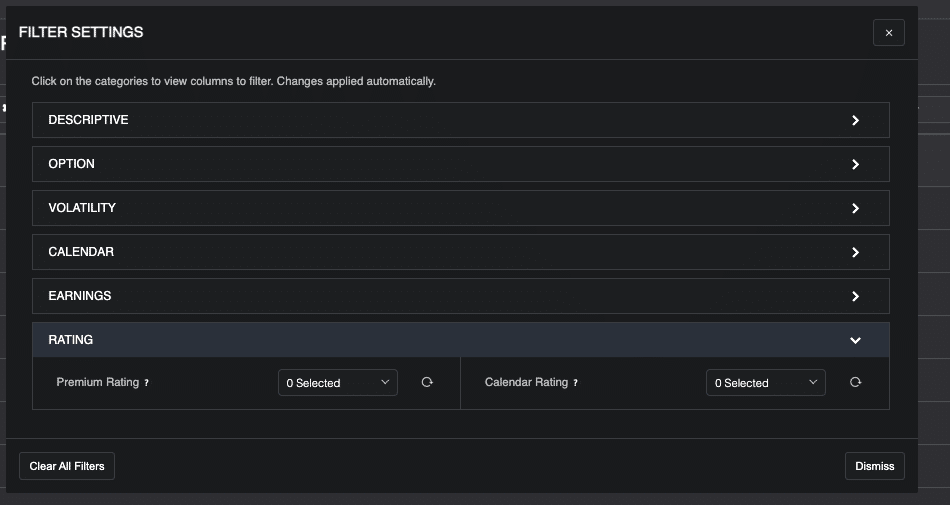
When you open the filter window, you will see that the filter options are organized into 5 categories: Financial, Option, Volatility, Calendar, Earnings, and Alerts.
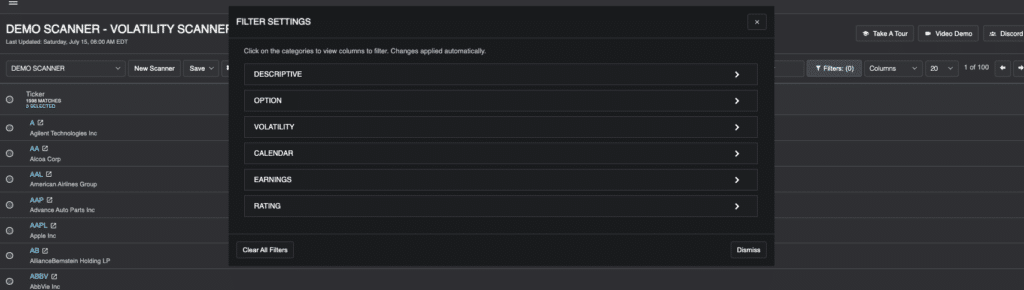
The filter options are organized in this way to make it easy for you to navigate. Here is what you can expect in each one:
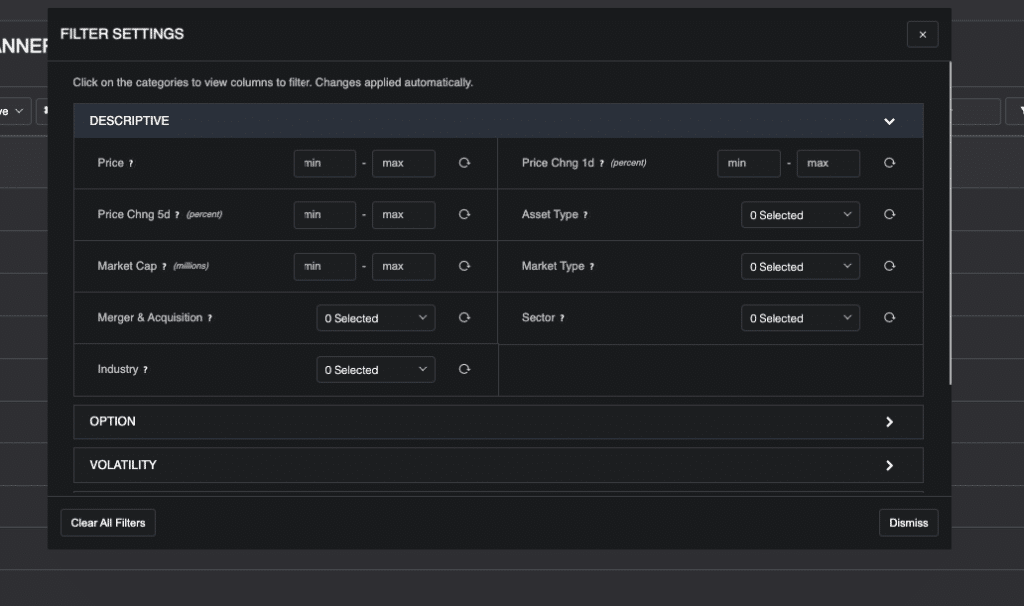
Descriptive:
Descriptive filters are based around the company and it’s underlying stock. This is where you can set parameters for things like price, price change, industry, market cap, whether you want to see stocks or ETFs, and whether there is any merger/acquisition news.
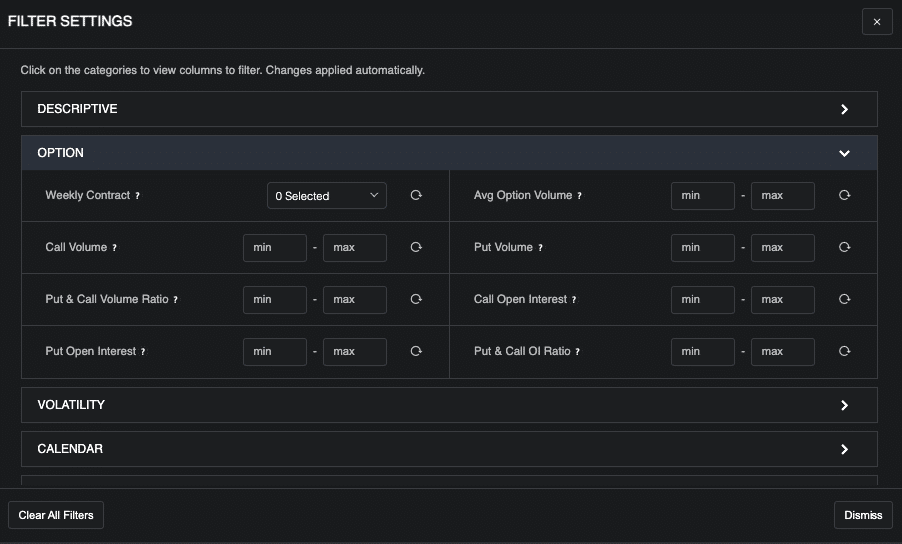
Option:
Option Filters are based around the actual option contracts themselves. This is where you can set parameters for things like having weekly contracts, average option volume, call & put volume, open interest and put call ratios.
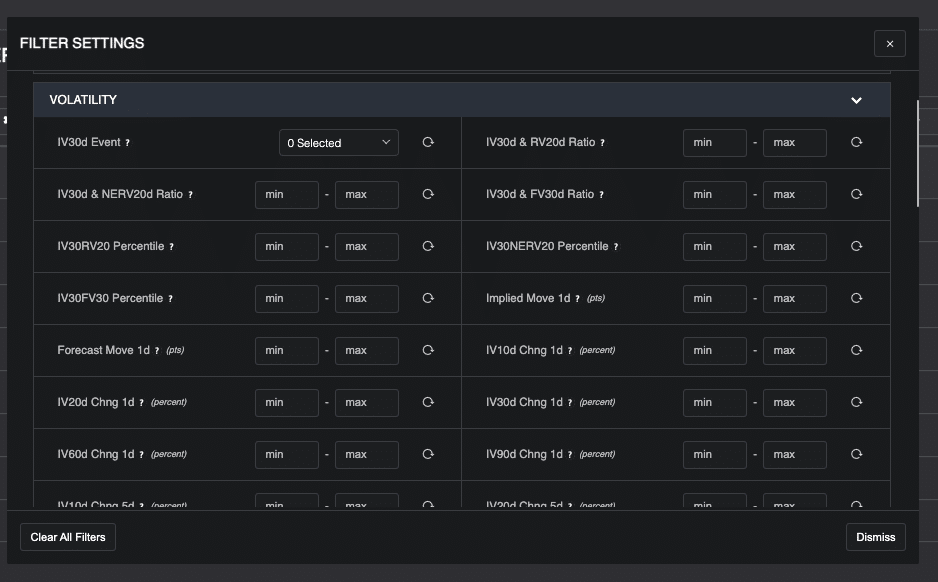
Volatility:
Volatility filters are based around IV, RV, and FV data points. This is where you get really specific with the trade criteria you are looking for when buying or selling options. You can set parameters for things like 1d implied and forecasted moves, volatility ratios (IV/RV, IV/FV, etc), IV changes for different expirations, ratio percentiles, and more.
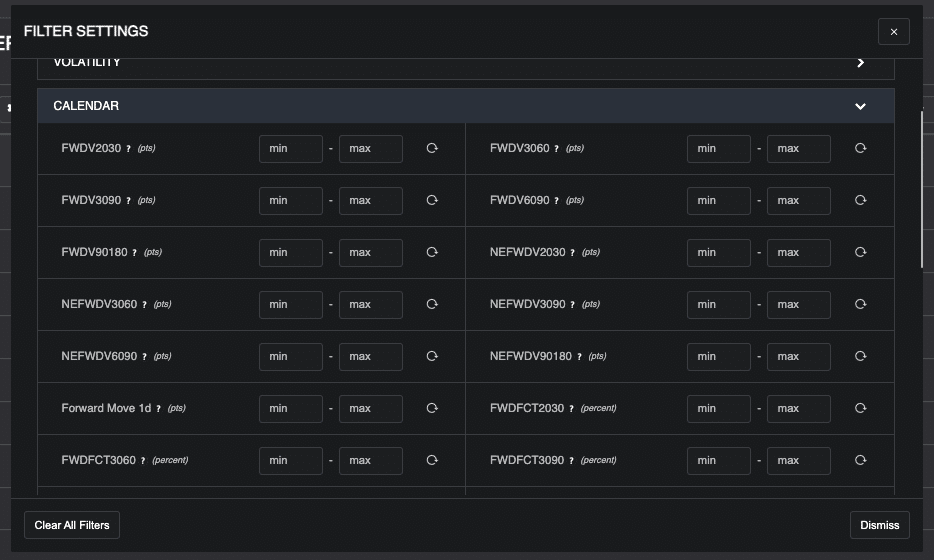
Calendar:
Calendar filters are based around forward volatility and term structure slope data points. This is where you can get really specific with the trade criteria you are looking for when buying or selling calendar spreads. You can set parameters for things like 1 day forward moves, forward factors for different expirations, slopes between different expirations and slope percentiles.
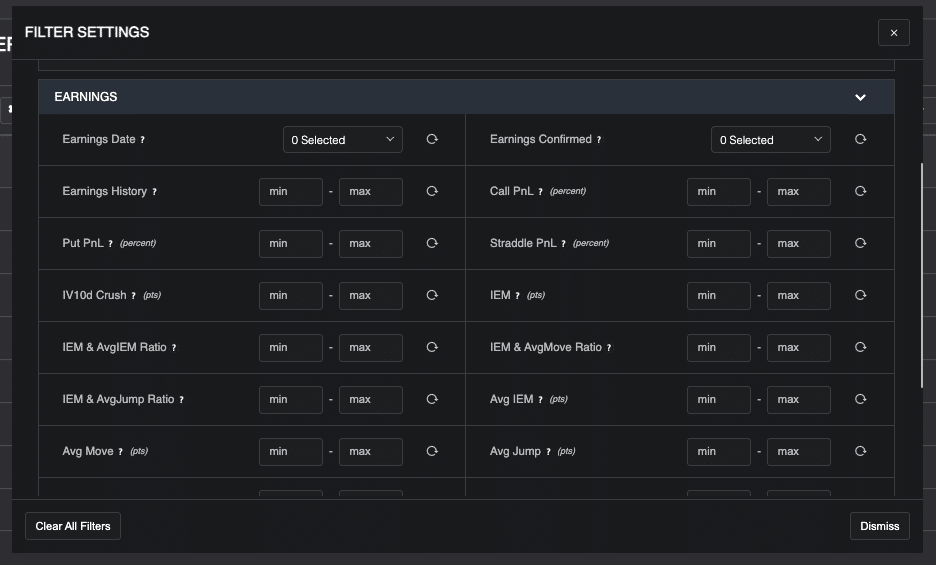
Earnings:
Earnings filters are based around earnings dates, moves and strategy performance. This is where you can get really specific with the trade criteria you are looking for when buying or selling options around earnings events. You can set parameters for things like IV crush, straddle PnL, Implied Move, Implied * Realized move ratios, median move, max moves, etc.
Ratings:
Included in the PA terminal are ratings / alerts for different types of trades. Right now there are 2: Premium and Calendar Ratings. For each of these ratings they can range from “strong buy” to “strong sell” and using the filters in this section you can choose to look for tickers who meet a certain rating based on the data in the terminal.
How to work the filters
You can think of the filters as a set of criteria that you are looking for. For example, if you want to build a scan for expensive options around earnings today, you may want to look for tickers with a price above $10, 2000 daily option volume, earnings today, and an implied move VS average move greater than 1.
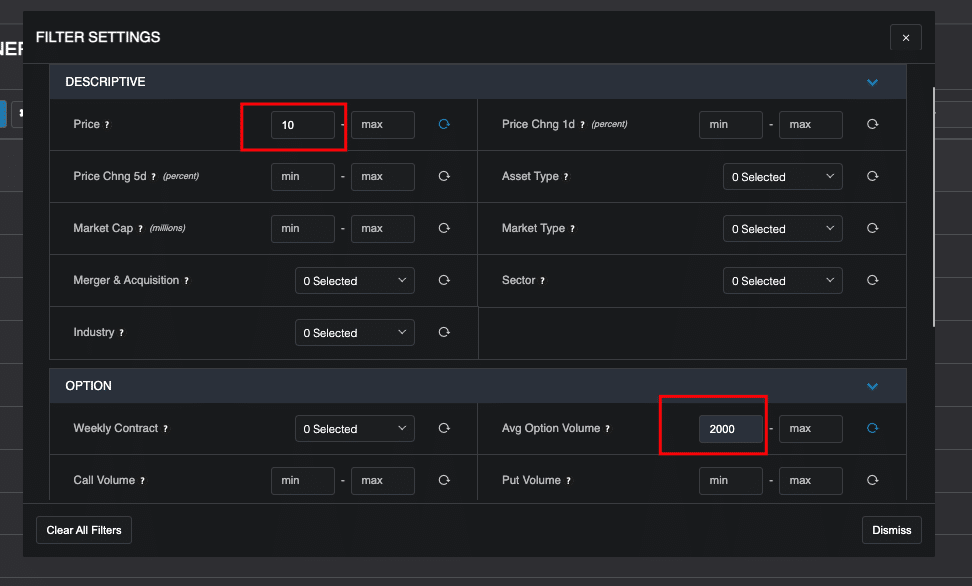
The filters are what allow you to build a scan like this (or any others)
Within the filter window, there are three different types of filters that you can use to build your scans: Yes/No filters, Include/Exclude filters, and Min/Max filters.
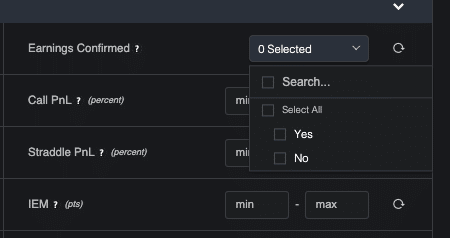
Yes/No filters:
These filters are pretty straightforward. You can think of these as asking you the question “Do you want to include tickers with X?” For example: the “Earnings Confirmed” filter has the options Yes or No. If you click yes, you will only see tickers which have a confirmed earnings date. If you click no, you will only see tickers with an unconfirmed earnings date.
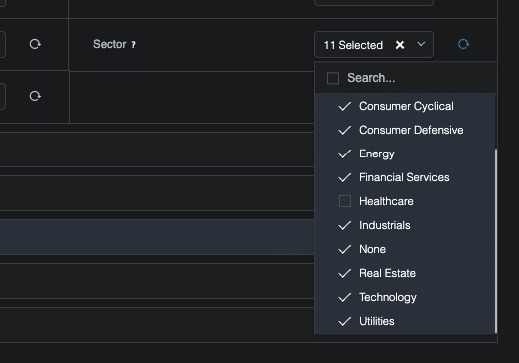
Include/Exclude filters:
Sometimes you want to be able to include or exclude tickers based on certain characteristics. An example of this is the industry or sector that a ticker belongs to. “I want this scan to only include tickers from the Basic Materials sector” could be one example of this. Another example is “I want to view tickers for all industries except for Biotechnology”
In the first case, where you want to scan for only tickers in the Basic Materials sector, you would click on the drop down for sector which would show you all available sectors (currently unselected). From there, you would simply click on “Basic Materials” and it would automatically apply this filter. You will know which tickers are selected because there will be a checkmark to the right of the sector name.
In the second case, where you want to actually exclude something rather than include it, you will need to do one extra step. So to view all tickers except the ones in the Biotechnology industry, you would go to the industry filter, click it and select all industries by clicking the square beside the search bar. Once all industries are selected, you go to Biotechnology and unselect it. The logic for this follows the same as the first example, where the selected one are what is showing up. So to exclude something, it needs to be the one that is not selected.
Min/Max Filters
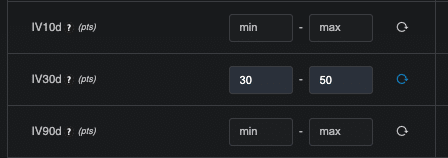
Min max filters are used for number based metrics. By default, a scanner includes all data points for all tickers. For example, if we are looking at IV30d, the scanner is showing all tickers with an IV30d from 0 to infinity.
But let’s say you want to only view tickers with an IV30d between 30 and 50. In order to set this criteria for your scan, you would simply go to the IV30d filter (found in the volatility section of the filter window) and input 30 into the box labelled “min” and 50 into the box labelled “max”. Once this is done, the scanner would automatically to only show tickers who meet the criteria of having an IV30d between 30 and 50.
Step 3: Set the columns you would like to see on your scanner
Once you have set your filters, the scanner will already be showing the tickers that meet your criteria. But now you will want to do two things:
- Pick what data points you want to actually see on the table for each ticker
- Pick what data point you want to sort (rank) the tickers by.
How to pick which data points you want to see on the table
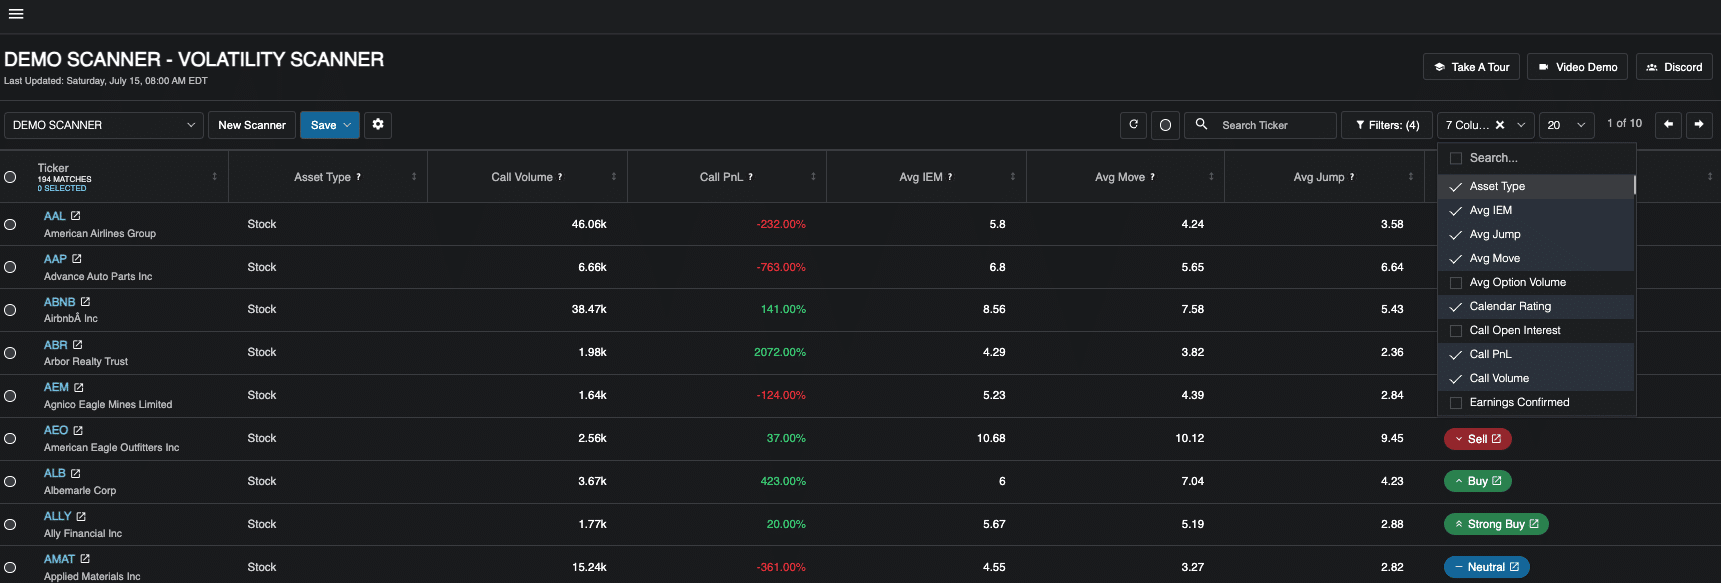
When you add a new data point to the table, a new column will be added specifically for that data point. To start adding (or removing) columns, you first need to click on the “Columns” button in the top right corner of the scanner.
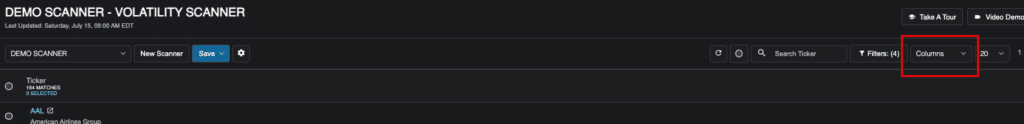
Once clicked, it will open a dropdown menu that contains all of the data points available in the scanner. They should look familiar, they are the same ones available in the filter box!
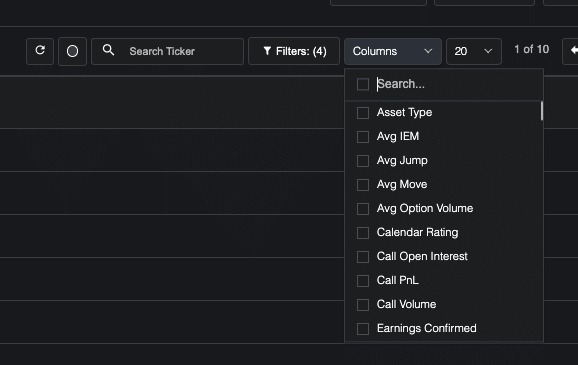
They are organized in alphabetical order to mak eit easy to scroll through them. You can also use the search box at the top to look up a specific column that you want to add.
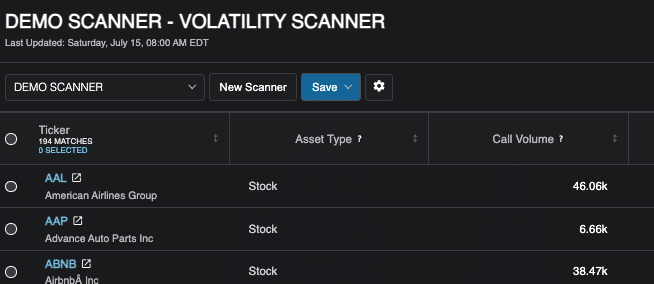
Beside each option there is a square. Assuming you start with a blank scanner, they will all be an empty square. To add a column, simply click on the data point you want to add and the square will change to a checkmark. You will also see the new column appear on the scanner immediately.

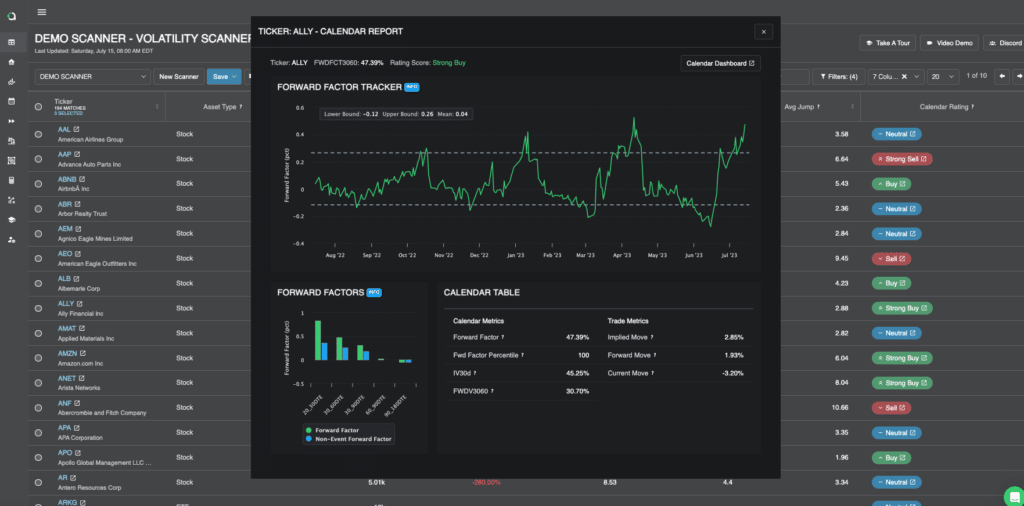
Some of the Metrics Are Clickable!
Of the metrics you can choose to have on your scanner dashboard, some of them have a click functionality that pulls up more information for you.
At this time, the Ratings and Reports metrics have this functionality. For each of the Premium, Earnings and Calendar metrics, you can click on the rating given to the ticker you are looking at and a new window will pop up with the key information related to the alert. This functionality makes it easy for you to quickly assess trades without needing to leave the scanner.
For example, if you see a “Strong Buy” Calendar rating on, you can click on this rating and quickly see why this rating was given.
Column Selection Tips & Tricks
Something important to remember is that you don’t need to include columns for metrics that you have already filtered for unless you want to see the specific number for that data point.
For example, if I have set a filter to only look at small cap tickers, I don’t need to have the market cap column since I know that they are all small cap already. This is important because you want your scanner dashboard to be easy to read and interpret. Try to only include the necessary data points.
Always remember that you can adjust your scanner as you go and create variations of it. They are flexible in design, so you can always improve it as you improve your strategies!
Step 4: Save Your Scanner!.
Always remember to save the changes that you make to your scanners. To know if you have unsaved changes, you can look at the “Save” button. If it is blue, then there are unsaved changes.
When you click “Save:, you will have two options: Overwrite Current, and Save as New.
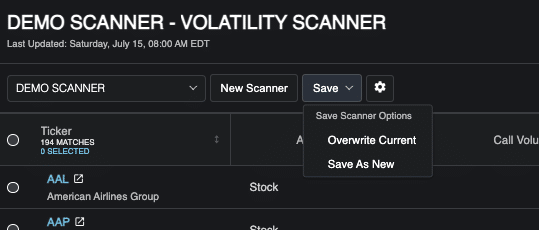
To save over the current scanner you are on, simply click Overwrite Current and you will save over the scanner.
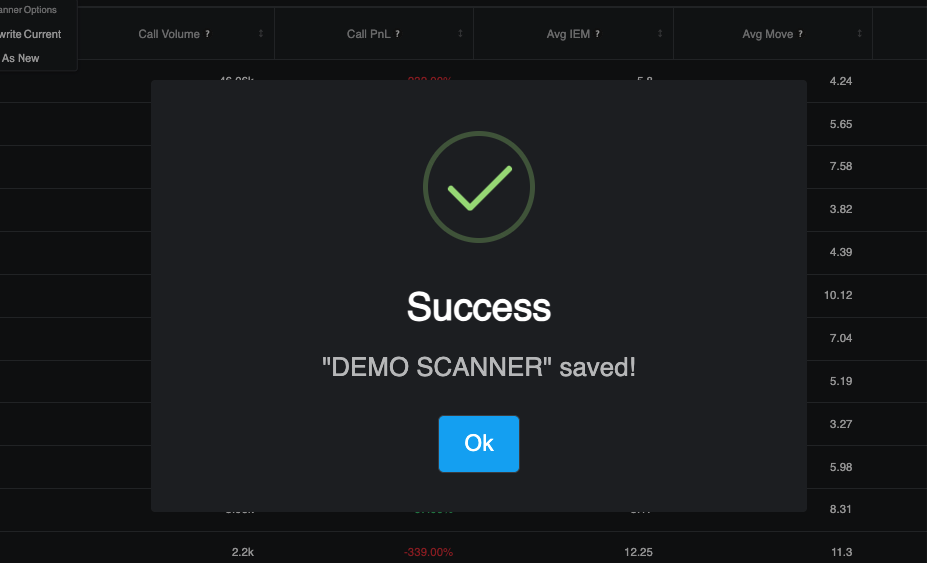
If you want to create a brand new scanner based on the changes you have made, click “Save As New” and then you will be prompted to create a name for the new scanner. once you do this, you can click save and you will have the original scan you made AND the new one!
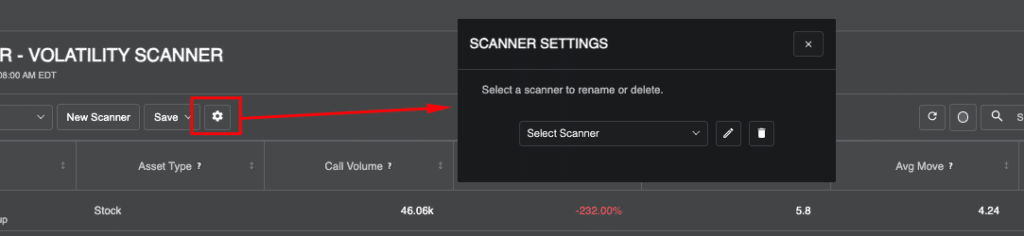
What If You Want To Delete a Scan?
To delete a scan, click the gear icon next to the “Save’ button. Once you are in this window, use the “Select Screener” drop down to select the screener you want to delete. Once selected, click the garbage can icon. You will be asked to confirm that you want to delete this scan. Once confirmed, the scanner will be deleted.
Conclusion
Congratulations! You’re now equipped with the knowledge to build custom scans that will unleash your trading potential. By leveraging over 150 metrics, you can explore the market with precision and discover those highly sought-after, profitable trades. The ability to save up to 30 custom scans ensures that you’ll never miss an opportunity. So, gear up, dive in, and let your scans drive your trading success!