Option sellers make money because on average the amount of movement that the market thinks a stock will experience in the future is less than what actually happens. This means that the option prices are on average, expensive.
In previous articles we covered what volatility is, and now it’s time to frame it into the context we are actually going to be trading most of the time. This frame is what we call the difference between implied volatility and realized volatility.
Buckle up because once we are through this topic you are going to have a whole new understanding of trading.
Key Takeaways
- Implied Volatility vs. Realized Volatility:
- Implied volatility (IV) is the market’s forecast of a stock’s future volatility, whereas realized volatility (RV) is the actual volatility that happens over that time period. When implied volatility is higher than the realized volatility, option sellers make money.
- Impact on Option Pricing:
- Options are priced based on implied volatility. Higher IV indicates higher expected price movements, leading to higher option premiums. Conversely, lower IV results in lower option premiums. Traders can leverage this knowledge to make strategic decisions about buying or selling options.
- Strategic Trading Based on Volatility:
- When we trade options, we are trading volatility. The words “option trader” and “volatility trader” should be synonymous if you know what you are doing. As option sellers we are always trying to find areas where the implied volatility is expected to outpace the realized volatility. When we can find areas where this happens consistently, it can be said that we have identified an area where the variance risk premium can be monetized and the potential for a new strategy is found.
Implied Volatility vs. Realized Volatility: An Overview
To begin, let’s define these terms:
- Implied Volatility (IV): This is the market’s forecast of how much a stock is expected to move over a certain period in the future. It’s a predictive measure and reflects the market’s sentiment.
- Realized Volatility (RV): This is the actual movement of the stock over a specified period. It is retrospective and reflects what happened.
Think of it like this: If you’re at a horse race and you’ve done extensive research, you might conclude that a horse named Seabiscuit has the best chance of winning. Based on this prediction, you place a bet. This prediction is akin to implied volatility. Once the race is over and Seabiscuit either wins or loses, the outcome represents realized volatility.
How Implied and Realized Volatility Work in the Market
Imagine you’re considering trading a 30-day options contract for Apple, with an earnings event scheduled during this period. To break it down:
- Market Analysis: The market looks at historical data, current trends, and upcoming events to predict future movements.
- Implied Volatility Calculation: Based on this analysis, the market might determine that Apple will have a 30% volatility over the next 30 days. This predicted movement impacts the pricing of options, which will reflect the movement the market expects between now and expiration.
- Reality Check: As time progresses, the actual movement of Apple’s stock might be different from the predicted 30%. This difference is where traders can find opportunities.
If the actual (realized) volatility is less than 30%, the options would have been overpriced, meaning that (controlling for variables such as delta exposure) option sellers would have yielded a profit. Conversely, if the realized volatility exceeds 30%, then option sellers would have realized a loss on this trade.
The Importance of Understanding Volatility for Options Trading
If you ever want to be able to answer the question “Why did my trade make/lose money?” then you need to understand the difference between implied and realized volatility.
More than that, this is a concept that underpins the existence of the variance risk premium, which is the entire reason we trade options to begin with. By understanding these concepts, traders can:
- Identify Mispriced Options: Determine if options are overpriced or underpriced based on their own analysis.
- Estimate What The Future Will Look Like: Use their predictions of future volatility to guide their trading strategies.
- Create Strategy Return Expectations: When you are able to effectively measure, compare and interpret the differences between implied and realized volatility, then you are able to paint a picture of how a given strategy should perform.
Practical Applications and Moving Forward
Understanding implied and realized volatility enables us to make better trading decisions. As we progress, we’ll introduce more advanced concepts, such as how to accurately forecast volatility and use statistical methods to enhance our trading strategies.
Remember, options trading is a game of probabilities. By mastering these concepts, we set ourselves up for long-term success in the market.
Diving Deeper: The Impact of Different Market Conditions
Market conditions play a significant role in shaping implied volatility. For instance, during periods of market uncertainty or economic instability, implied volatility often rises. This is because traders expect larger price swings and increased market activity. Conversely, in stable market conditions, implied volatility tends to be lower as the expected price movements are smaller.
Understanding how different market conditions impact implied volatility helps traders anticipate changes and adjust their strategies accordingly. For example, if you notice that implied volatility is decreasing and you believe it is due to us moving from a high volatility regime to a low volatility regime, then there can be opportunities for option selling that may not be apparent to other retail traders besides you.
Real-Life Implications: A Case Study on Market Sentiment
Consider the period leading up to a major economic announcement, such as an interest rate decision by the Federal Reserve. Traders and investors might anticipate significant market movements based on the outcome of the announcement. As a result, implied volatility for many stocks and indices may rise, reflecting the market’s uncertainty.
Now, let’s say you analyze the market and believe that the announcement will have a less significant impact than others predict. You might find that the implied volatility is overpriced. In this case, selling options could be a profitable strategy as you expect the realized volatility to be lower than the implied volatility.
Conversely, if you believe the market is underestimating the impact of the announcement, buying options could be advantageous. By accurately predicting that the realized volatility will exceed the implied volatility, you can capitalize on the mispricing.
Leveraging Technology and Tools
This section is going to be a shameless plug for Predicting Alpha, because honestly we have spent 5 years building these tools and they are the best. These tools allow you to:
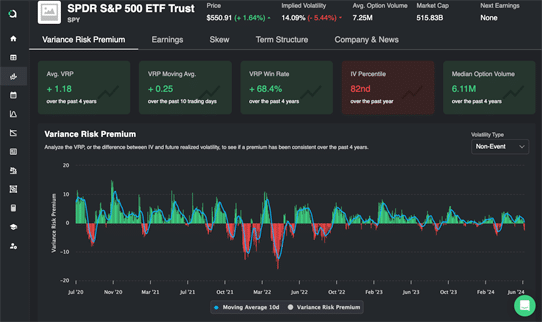
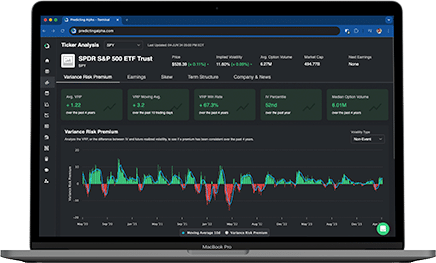
- Convert Implied and Realized Volatility into Variance Risk Premium: Pretty much half of the reason people use the Predicting Alpha terminal is that it handles all of the work of measuring the variance risk premium for different assets for you. Basically it processes all the data and shows you how much on average you can expect to earn by selling volatility on different assets and around earnings events (if you want).
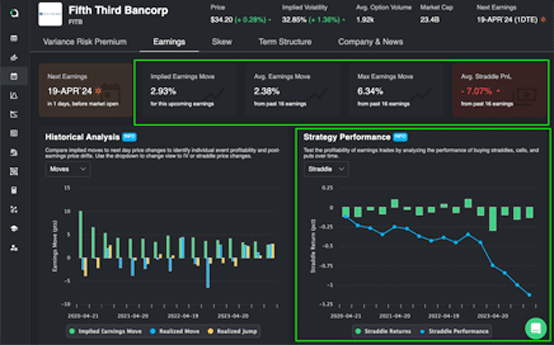
- Run Simulations and Scenarios: Another reason people use the Predicting Alpha terminal is to be able to backtest the performance of option selling strategies, which basically translates the variance risk premium from being a theoretical concept into the results you could actually expect to achieve if you added this asset to your portfolio.
- Scan for opportunities: Analysis is cool and all but you need to find things worth analyzing. What’s useful is that there are a lot of core metrics that come from running these types of analysis which can be used to filter and rank stocks and ETFs so we can find the ones that are actually worth analyzing to begin with. This is the third reason people use the Predicting Alpha terminal. For the strategies we run, it finds the trades that have a tradable risk premium for you. It’s pretty cool.
Leveraging these tools can enhance your ability to make informed decisions and improve your trading performance.
Conclusion: Mastering Volatility for Trading Success
You need to understand the differences and relationship between implied and realized volatility. Don’t just gloss over this, make sure you really get it. Because everything is built on this concept. Implied vs Realized volatility is what is going to get you paid, or cause you to lose money. So if you don’t get it, email me and I will help you out.


