A lot of traders will try to tell you that volatility is unpredictable. That all of the time spent by option sellers measuring and analyzing volatility is for nothing. But in reality, there are some key characteristics of volatility that help us forecast how it will behave in the future. It’s not different from how there are general characteristics of stock price movement. So in this article we are going to look at the characteristics for both volatility and equity prices.
Key Takeaways
- Stock Characteristics: Stocks are non-stationary and trend over time, with volatility increasing when prices decline.
- Volatility Characteristics: Volatility is stationary, mean-reverting, and exhibits clustering. It fluctuates within a specific range and tends to revert to its mean.
Three Characteristics of Volatility
This picture describes the key characteristics about how volatility changes that you need to understand. Volatility exhibits three key characteristics:
Mean Reversion
Volatility is mean-reverting, which means it oscillates around an average value. For the VIX, this average is around 14. When volatility moves above this mean, it tends to get pulled back down, and when it moves below the mean, it tends to rise back up. This pull towards the mean is a defining feature of mean-reverting assets.
Stationary
Volatility is stationary, meaning it stays within a specific range and tends to revert to its mean. The VIX (Volatility Index), for example, fluctuates between 9 and 80 over a 30-year period. This characteristic makes it a stationary process, as it doesn’t trend indefinitely in one direction.
Clustering
Volatility clusters, meaning it tends to stay high when it’s high and low when it’s low. This clustering effect implies that volatility doesn’t simply spike and drop back immediately; it often remains elevated or depressed for a period before reverting to its mean.
Ways to measure volatility
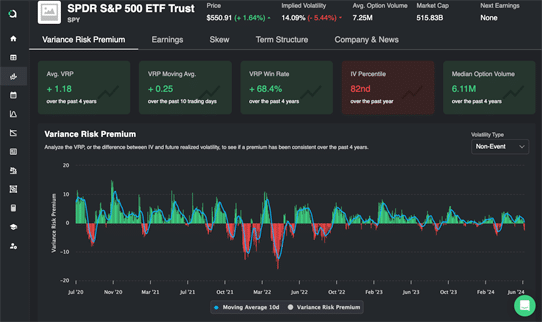
Given the characteristics of volatility one of the most effective ways to measure it is to establish what the average implied volatility, implied over realized volatility, and variance risk premium are. Once you have done this, you are able to visualize the range in which volatility moves for a particular underlying and use this information to forecast what future volatility may look like.
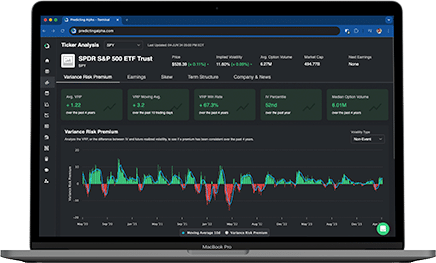
In Predicting Alpha this is something we commonly do for our ETF Premium strategy. We basically use the mean variance risk premium to sort ETFs into two groups: the ETFs that have a variance risk premium, and the ones that do not. We do this by examining a 4 year backtest of selling volatility on each ETF to see if the returns have been positive. Basically, we are conducting a backtest to see if after we account for costs, hedging, etc, has it been profitable to be net short options on a particular ETF.
This is a practical example of how we measure volatility to make real trading decisions. We take the characteristics that we understand about volatility, assume they should continue to persist, and then leverage them to make informed decisions.
Two Characteristics of Stock
Non-Stationarity
Unlike volatility, stocks are non-stationary and tend to trend over time. They do not stay within a fixed range but instead move directionally based on various factors such as earnings, economic conditions, and market sentiment.
Volatility Behavior
For stocks, volatility increases when prices decline, which is the opposite of how volatility itself behaves. When stocks drop, fear and uncertainty rise, leading to increased volatility.
This is where the saying “stocks go up like an escalator and down like an elevator” comes from. It’s a saying to help us remember that stocks slowly trend up and then realize the majority of their volatility to the downside.
Indicators for Trading Stocks
I am going to start this section by saying that I am not an expert in trading stock. Our focus is in the world of volatility. But given that we understand some of the key characteristics of stock, and how it moves, we can make some assumptions about the types of measurements that should be useful in constructing a strategy.
Given that stocks trend, trend-following indicators like moving averages should yield some interesting insights.
Moving Averages Example
Using moving averages, traders can capture long-term trends by buying when the stock price crosses above a moving average and selling when it crosses below. This method leverages the trending nature of stocks, which is distinct from the mean-reverting nature of volatility.
Conclusion
Whenever we are trading an asset, whether it be stock or options, we need to understand how they behave. As you can see, even though options are a derivative of stocks, they behave in an entirely different way. It has completely different defining characteristics, and because of that, the types of measurements that you take in order to extract insights are different too.
Volatility is stationary and mean-reverting, while stocks trend.


