In this article I am going to teach you the most effective way to make money as an option seller.
Before we dive in though I need to give you a disclaimer.
This strategy.. is pretty boring. You are probably not going to brag to your friends about it. You aren’t going to wake up with adrenaline and rush to check your brokerage to see if you are up or down money.
It’s boring.
But it actually makes money.
Maybe not instagram influencer Lamborghini in 10 minute money.
But real money.
So if you are done with the cheap thrills that most of us have chased for years under the guise of “wanting to make money”, this article is going to set you on the right track.
And if you aren’t quite ready for that, book mark this for later. Because this strategy really works, and it’s going to keep working for a long time.
Meet the ETF Premium Strategy
Running a good volatility trading book/business means that you have a clean way to extract the variance risk premium. And the best way to do this is by selling options on ETFs.
This strategy is really nothing new. It’s the way that the majority of professional option selling funds get their start. It’s a simple service business.
Hedge funds want protection on their long equity portfolios.
We get paid for selling them that protection.
The end.
I’m serious. That’s all we do. I guess there is some nuance in how we find the trades, execute them, manage our costs.. but at a fundamental level we are glorified insurance brokers. Holding risks that others don’t want, in exchange for a premium.
This strategy takes maybe 30 minutes of work per week, so once you learn everything it’s actually pretty hands off. You’ll need the ability to sell naked options and access to some data (hint: we have pretty good data for this). And with that you will be off the races. Making money the boring way.
How to Run The Strategy
The strategy is simple. We sell options on a basket of ETFs that meet the following criteria:
- Has a positive variance risk premium that we can capture.
- Has an IV percentile lower than 80.
- Each ETF in the portfolio represents a different industry or market.
The execution is also simple:
- We sell weekly delta 20 strangles for 7 days and roll them for 4 weeks before rotating to a new ticker. We do not delta hedge unless there is a massive jump.
- If we want to hedge our downside risk, we can roll the weekly strangles under the protection of a 90 DTE delta 20 strangle.
This basket makes money. It outperforms. And it’s really low maintenance.
Here’s the entire strategy laid out for you.

We have a tool that makes step 1 easy (it shows us the best ETFs for this strategy and the backtests of their performance). All you need to do from there is pick the ETFs and place the trades.
That’s it.
I wasn’t lying when I said this was going to be boring.
But for the sake of being diligent individuals, let’s take 10 minutes to look at the performance and understand all the details about how this gets implemented.
I mean after all, we aren’t going to have much to do after we understand it, so we might as well put in a little bit of effort now, right?
Finding the Best ETFs to Trade
To successfully run this strategy, we have one core question to answer:
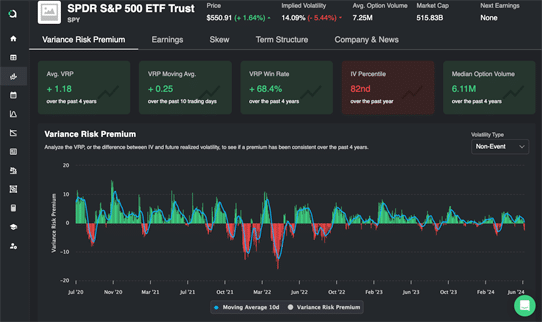
Which ETFs have a positive variance risk premium?
You can think of this as sorting ETFs into two buckets. The “Haves” and the “Have Nots”.
Those that “Have” a variance risk premium are fair game for our portfolios. The ones that do not are removed from our analysis.
This strategy uses 3 factors to find profitable trades
- We only trade ETFs.
- They must have a positive VRP.
- Their IV Percentile must be below 80.
Let’s go over each of them briefly:
Why do we only trade ETFs?
There are 3 major reasons :
- ETFs have added premiums baked in because of correlation risk (all the holdings become correlated in a crash). In fact it has been argued that the majority of the variance risk premium is due to this correlation risk.
- ETFs are a common place for funds to hedge their book (good liquidity and sector exposures)
- ETFs don’t carry the same bankruptcy and upside jump risk that individual stocks do (less blow up risk)
Why must there be a positive VRP?
I hope this one is self explanatory. If it’s not, go back and read the article on variance risk premium. For good measure, here’s the clarification: This metric is to utilize VRP’s long-term mean reversion to indicate if an ETF has the risk premium. Basically, if the average VRP is positive, then on average, we should capture a positive VRP.
Why must the IV Percentile be below 80?
We set a threshold for IV Percentile below 80 to reduce the strategy’s variance. While higher implied volatility (IV) results in a higher variance risk premium (VRP) in points, it also increases the strategy’s variance. Normalizing VRP as a percentage doesn’t show a clear relationship with IV levels. Therefore, avoiding high IV environments maintains your return on VRP while reducing variance.
Finding Trades for the ETF Premium Strategy
Finding trades is really simple. Built into the Predicting Alpha terminal is a scan called the ETF Premium Strategy scan.
This searches all ETFs and presents you with the ones that have the following characteristics
- A positive variance risk premium.
- A profitable option selling backtest.
- An IV percentile lower than 80.
These three characteristics are the core of what we look for when running this strategy. All ETFs that meet this criteria are fair game.
Open the scanner, immediately see a list of the top trades
All tickers on this scan will meet the core criteria for being a good trade. Empirically, you could trade all of them (this would actually give you the smoothest PnL).
But in reality we do not have the time or resources to be managing 50 trades at any given time.
Note: Something extremely important to remember is that fundamentally in this strategy we do not differentiate between which ETFs have a “better variance risk premium”. Our entire approach is based on trying to identify which world an ETF belongs to. The first world is the one where the ETF has a risk premium we can monetize. The second world is one where the ETF does not have a risk premium we can monetize. You can customize the scanner and do your own ranking/analysis, but that is outside of the scope of what the core of this strategy is.
How do we pick which ETFs to trade?
So if our goal is to pick the ETFs that can offer us the best performance for our limited account size and management capabilities, how do we pick?
We can achieve 90% of the benefits by focusing on 2 variables to help us make our decision.
- Diversification
- Liquidity
The reason we focus on these two things is because they help us control factors that surround the risk premium, allowing us to get a cleaner exposure to it and therefore a smoother PnL. When we can only trade a limited number of ETFs, we optimize for these two things.
Variable 1: Diversification
The first variable is diversification. Diversification is a well understood way to improve your returns. It’s what people are talking about when they say stuff like “Don’t put all your eggs in one basket”.
The idea is simple. The more different ETFs you can trade which all have a positive variance risk premium the better.
The key word in the above sentence? Different.
Imagine you are looking at the following list of ETFs and picking the ones you want to add to your portfolio.
You went through this article, so you know diversification is important. You decide to trade 3 ETFs.
Scenario #1
In scenario #1, you pick KWEB, ASHR, and FXI. They all have a positive risk premium, and they are all separate ETFs… right?
Well if you take a closer look, you’ll notice that they are all ETFs that are focused on the Chinese economy. And if you put them into a correlation matrix, you’ll see..
You’ll find that they are all extremely correlated with one another! What looked like 3 separate trades was actually much closer to one giant trade. Attempt at diversification, failed.
Let’s check out scenario #2.
Scenario #2
This time we are going to pick a different set of ETFs from the same list. Let’s say we pick KWEB, URA, and BITO.
One is focused on the Chinese economy, another on uranium, and the third on bitcoin.
And if we put them in the correlation matrix..
A very different picture! Each of our selected ETFs show very little correlation to one another. Meaning that if we placed these 3 trades, we would be trading ETFs that each have a positive variance risk premium and very little to do with one another. Just because one experiences higher realized volatility, it doesn’t mean the others have to as well.
So this is what we do for diversification.
Once we have selected the ETFs we want to trade, We plug them into the correlation matrix, a tool in the PA terminal that shows you the correlation between the ETFs you’ve picked.
We are checking to make sure they are not the “same thing under different tickers”. Doing this will help improve our PnL, without us needing to try to be wizards and predict the future.
Variable 2: Liquidity
If you have to choose between two ETFs with a positive variance risk premium, and one is very liquid while the other is completely illiquid, you should pick the liquid one.
The reason? You need to be able to get in and out of your trades.
Trading in illiquid markets can pose a lot of challenges that we want to avoid if there’s no benefit to being there. So if you have too many ETFs to pick from, an easy way to narrow down the list further is to increase your liquidity threshold in your scan.
Liquidity Example
Using the list from our previous example, let’s see what we mean by liquidity in real time. In this screenshot, I have taken the same list but added a column for average option volume as a proxy for liquidity.
Let’s say we decided that we wanted some exposure to China and we were deciding between FXI and ASHR.
Both have a positive VRP and are roughly the same size of trade (both around $25 underlying price). But if we look at the option volume, we can see that FXI has almost 15x the volume.
Intuitively we will be inclined to trade FXI, but just to show you the difference lets pull up the trade for both of them.
Weekly short strangle on ASHR
As you can see, the spread is 0.05 – 0.12 for the strangle. The bid/ask spread is 58% of the highest premium we could receive!
Let’s compare this to FXI.
Weekly short strangle on FXI
As you can see, the spread is 0.14 – 0.18 for the strangle. The bid/ask spread is 22% of the highest premium we could receive.
A significant improvement over the spread we would pay for ASHR!
Just by picking to trade the more liquid ETF we have significantly improved our chances of making money.
And that is how you find trades!
We continue to find ETFs with ideal conditions to be added to our portfolio until we have an acceptable number of trades on and are utilizing our margin appropriately.
As we take off positions and our capital becomes available, we rotate into new trades.
I know you are probably thinking “That’s it? How can that be all we need to do in order to do something so profitable?”
It’s because the hard work was done before you ever looked at the list!
The hard work is understanding the risk premium, finding the meaningful variables that help us find the optimal trades to take, and realizing that all we are trying to do is put together a basic model that helps us build out our basket. We are already leaning heavily into the existence of the risk premium, and just optimizing our ability to extract it.
That’s why it’s so simple. The hard work has already been done, and it’s what’s presented to you in this course and made tradable with our tool.
Now that we have covered how to find the trades, let’s talk about the actual trade we are going to place to make some money.
How to Structure a trade to capture the ETF’s Variance Risk Premium
OK, I understand why this strategy is so good. I know how to find trades. But how do I actually capture the variance risk premium?
The quick answer:
- The core of this trade is to sell 7 DTE, delta 20 strangles.
- If you want to hedge against major drawdowns, buy a 90 DTE delta 20 strangle.
- Roll into a new short strangle at expiration, do this for 4 weeks before considering rotating to a new ticker.
- Close out the 90 DTE delta 20 strangle (if you bought this hedge) after the 4 weeks are up.
The long answer:
The trade is a bet that future realized volatility will be lower than today’s implied volatility. There are many structures that can make this bet with different pros/cons but the two cleanest ones are a short straddle or strangle.
The ETF Premium strategy opts for a short strangle to harvest the VRP with the option to buy a hedge to cap the risk – in the form of a long farther dated strangle
What structure do we trade?
When it comes to picking the optimal structure to use in a specific strategy, there are 3 key decisions. They are listed below, and we provide a recommendation and supporting evidence for the best decision in each category when trying to capture variance risk premium.
Structure Decisions
- Structure
- Delta neutral, short gamma, long theta, short vega. A short strangle is what we sell.
- Expiration
- The shorter the expiration, the greater the VRP. 7 DTE is what we sell.
- Strikes
- The VRP is highest in OTM puts. Delta 20 strikes is what we sell.
How we chose the strikes and expiration to trade
The recommendation is to pick delta 20 strikes and trade 7 DTE expiration. This means that we are trading a delta neutral strangle. There are two reasons that this is the optimal trade.
Reason 1: This is where the risk premium is the highest
Option selling theory tells us two things:
- Selling shorter expiration options should have a higher risk premium because the impact of large moves is greater, and this is what options are used to hedge against.
- Selling OTM options should have a higher risk premium because there is more convexity (less dollars collected upfront for a larger loss if there’s a big move).
Following these two principles, it would make sense to sell short dated, out-the-money options if you are looking to maximize your return.
Research into selling options at different strikes and expirations has confirmed this to be true.
Examine the graph below provided by AQR Capital Management. Each line represents a different length expiration, the X axis is different strikes, and the Y axis is the alpha (excess return).
Note: The alpha is defined as the delta-hedged returns minus the full period’s beta to SPY. We can see that the shorter the expiration, the greater the alpha, and slightly below the ATM is where it peaks
As you can see, Front Month options that are roughly -0.5 standard deviations out the money have the greatest return. This is why we sell shorter dated expirations and delta 20 strikes.
Reason 2: Reduced delta hedging costs
There are some challenges in option selling that retail traders need to overcome in order to run a profitable strategy. The biggest one is that we do not have a trade that exactly replicates the PnL of the difference between implied and realized volatility. This means that over the course of our trade, we will have varying exposure to delta, or the direction that the stock moves.
To mitigate this, we do something called delta hedging, which is where we trade either shares or options to offset our exposure to delta, allowing us to focus on PnL on the difference between implied and realized volatility (what we want).
But delta hedging is a double edged sword. On the one hand, if we don’t delta hedge frequently, we are adding a lot of noise to our trade PnL (the impact of the stock price drifting can be greater than the impact of implied VS realized volatility).
On the other hand, delta hedging is not free, nor is it cheap. So the more frequently we have to do it, the more we spend and if we are overhedging those costs can also outweigh our edge over time!
Seems like we are stuck between a rock and a hard place.
So the optimal solution that we have discovered is to simply trade a structure that requires less hedging.
And funny enough, this structure happens to also be the one that has the highest risk premium.
The structure we are talking about is the 7 DTE, delta 20 strangle.
- By trading wider strikes, we allow for more movement in the underlying stock price before it “breaches” one of our strikes. This means that we can allow the stock price to drift around more without needing to hedge.
- By trading shorter dated expirations, we are less exposed to a slow drift in the underlying price because it only has 7 days to move compared to having 30 or 60 days to move.
- At the end of 7 days, we are “re-striking” (opening a new strangle at new strikes), which is equivalent to us delta hedging once per week (without the added costs!).
Trying to solve the problem of uncovering the most VRP and minimizing the headache of delta hedging costs is how we discovered the power of the 7 DTE short strangle.
It’s awesome.
Note: What we are really saying is that short DTE strangles are good. If you prefer to trade a 14 DTE short strangle, be our guest. We personally opt for the 7 DTE where we can, but the difference is not substantial enough for us to argue over it.
Should We Use A Hedge?
When we say hedge, we are talking about buying protection against “disasters”. For example, putting something in place to limit our max loss in the case of a market crash.
When deciding if you should purchase a hedge or not there are a couple of considerations:
- The main one is that hedges are not free and they eat into our edge. We are the ones providing hedges to other people.
- The second one is that if you are going to purchase a hedge, you need to make sure to buy something that protects you in worst case scenarios. Don’t be risk averse and try to focus on getting a good “risk reward” trade (this will kill your edge).
Remember, we are the insurance providers. We should expect an outsized loss compared to our gain on each trade. Seeing a “good risk reward ratio” is a sure sign that you are being too risk averse.
If you choose to buy a hedge, the optimal structure is to add a 90 DTE long strangle to act as protection as you continue to roll weekly short strangles. This is called a strangle swap.
What is the tradeoff of choosing to include a hedge or not?
Let’s take a look at how these pros and cons play out with an example.
The strangle hedge costs us about ⅓ of our profits. But what we gain is significantly reduced risk. Let’s dive deeper by looking at an an example on SPX to how the hedge impacts our risk profile.
SPX Strangle vs Strangle Swap Example
Here is an example of what the short strangle trade would look like on SPX.
This is stressed to an 8% move up or down in 1 week. If that were to happen, we would lose about $4,000 bucks for each lot (ouch). But keep in mind, an 8% 1 week move in the S&P is wild.
Here is what the strangle swap looks like (add the 90DTE strangle as protection).
At first glance it may not look that difference, but pay attention to the PnL numbers on the side. You will notice the range is reduced.
This is once again stressed to an 8% move up or down in the week. We would lose about $2,400 bucks for each lot (almost 50% less ouch). But this comes at a cost of over 60% of the premium we collected.
As you can see, hedging comes at a cost.
The strangle swap is designed to balance generating returns (via selling short dated strangles) with protection from market crashes (buying long dated strangles). But this hedge comes at a high price, and eats into your edge.
If you want to maximize your absolute returns, drop the hedge and just sell strangles. But if you are willing to reduce your gains for a much more controlled risk profile, selling weekly strangles under the protection of a 90 DTE strangle is the best way to do it.
NOTE: If you choose to buy the long dated strangle as a hedge, you open it at the start of the trade cycle (when you sell the first 7DTE strangle. You close out the hedge when your last short strangle expires (end of week 4).
Conclusion
Whether you choose to include the hedge or not, you make ZERO dollars if you never do anything. So get out there and start placing some trades.
So go put together your first portfolio. Place some trades. Meet the other traders running this strategy. And then take a break and go enjoy life (that’s what we are trying to do more of by trading, right?!)


