

This trade could return 3.5% on margin over 35 days.
Here is my analysis.
What is SLG?
According to Yahoo Finance:
“SL Green Realty Corp is an investment trust focused primarily on Manhattan commercial properties. As of December 31, 2022, SL Green held interests in 61 buildings totaling 33.1 million square feet. This included ownership interests in 28.9 million square feet of Manhattan buildings and 3.4 million square feet securing debt and preferred equity investments.”
Here’s how the stock has been moving this year:
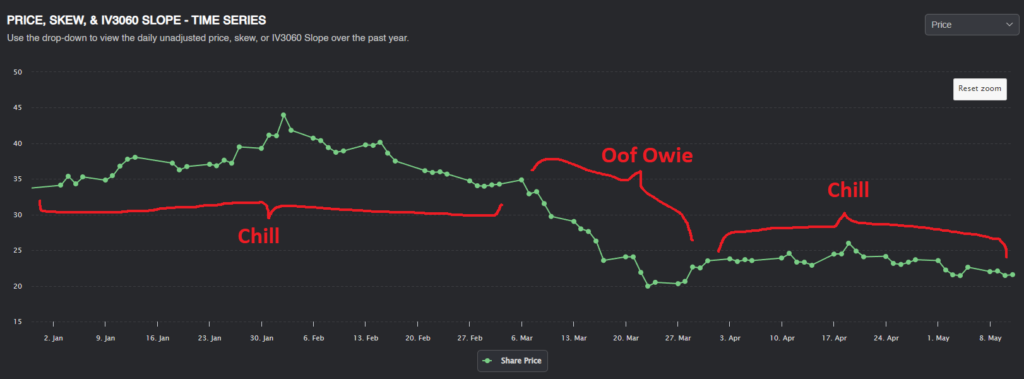
It seems like working from home is here to stay. This trend has definitely been reflected in the stock price, which has taken a beating this year. However, it seems like most of the drop took place in March, and the stock has stabilized since.
We can see a similar story in the volatility graphs:
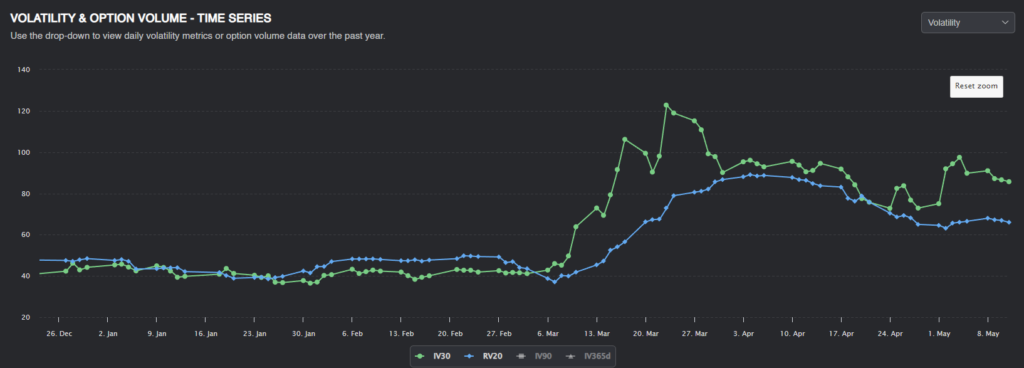
While volatility picked up in March, it has slowly started coming down since then. Interestingly, implied volatility spiked far above even the highest levels of realized volatility.
Since March, there has been quite a large IV/RV gap; selling options in April would have turned a nice profit.
Absolute Value Analysis:
We should first forecast the future volatility to determine if we have an edge in selling SLG volatility. There are many ways to estimate this from historical data.
- One estimate for future volatility is to use Predicting Alpha’s volatility forecast. The PA terminal takes a blend of IVs and RVs and combines them to forecast future volatility. For SLG, the terminal forecasts future volatility to be 54.75%.
- Another estimate for future volatility is simply using the 30-day realized volatility. Since volatility tends to cluster, the best estimate for future volatility can sometimes be historical volatility. The 30-day window ensures we have enough data without using data that may be too old to be relevant. The current realized volatility is 65.99%.
- Another simple estimate is to use the average IV/RV ratio to find what the average realized volatility should be. Since SLG has an average IV/RV ratio of ~1.02, realized volatility should be around 83.58% on average.
Relative Value Analysis
While we’ve seen that SLG implied volatility looks high relative to historical volatility, we can go one step further and compare the implied volatility of SLG to options prices of similar, correlated companies.
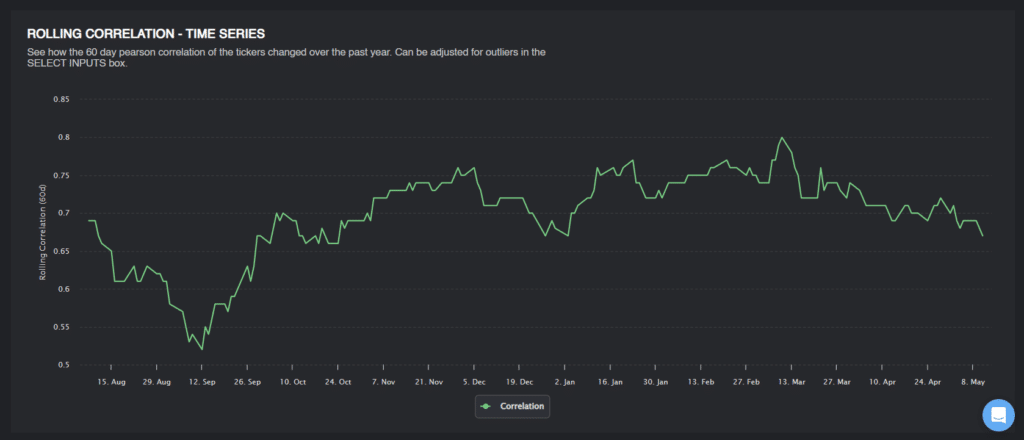
A quick check shows that IYG —the Ishares real estate ETF— has a fairly decent correlation to SLG, with a correlation typically greater than 70%.
Since these are correlated tickers in the same industry, it makes sense for the two stocks to have similar IV/RV ratios. Any upcoming catalyst would likely affect both real estate stocks, which would then be priced into implied volatility of both stocks. If we see that the IV/RV ratios of the two stocks are significantly different, this would help confirm that we have a trade opportunity.
Plotting IV/RV Ratios
Since March, the IV/RV ratio for SLG (green) has been significantly higher than IYR (blue)
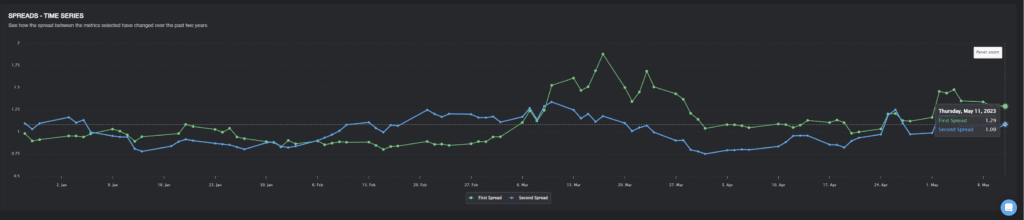
Assuming we haven’t missed any company significant catalysts, we could try to price SLG volatility relative to IYR volatility.
If SLG had the same IV/RV ratio as IYR, realized volatility would have to be 78.03%.
Forecasting Volatility
From our research, SLG options are likely overpriced. As good traders, though, we want to price these options and quantify how large our edge is.
I will do this by taking an average of all our estimates:
- PA Vol forecast: 54.75%.
- Realized volatility: 65.99%.
- Average IV/RV Adjusted RV: 83.58%
- SLG IV/RV Adjusted RV: 78.03%
The average of all 4 estimates is 70%.
Given this forecast of volatility, Given this forecast of volatility, here is the current price of the straddle and the “fair value” given our volatility forecast.
The June $20 Monthly Straddle should cost $4.53 as of the close on May 12.
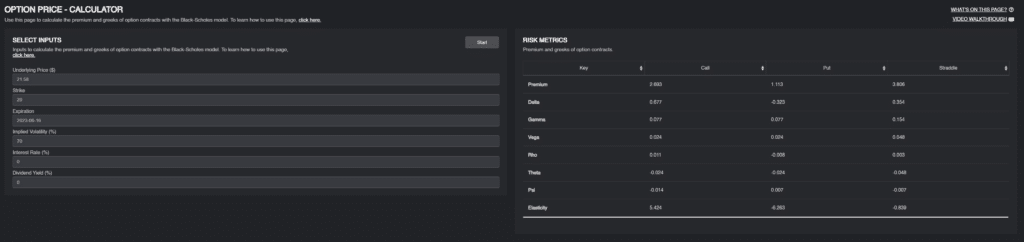
If we estimate the price of the straddle at a 70% implied volatility, the straddle should only be worth $3.81! This is just over $70 of edge. If we assume a conservative $2,000 in margin requirements (after delta hedging), $70 in profit translates to 3.5% return on margin over 35 days. Not bad.
Position Sizing and Management.
For a trade like this, I am not looking to load the boat on it. This is just another part of a short volatility book, but with some good research to back it ( when you build a book of trades like this, you do pretty well).
Stressing the position to an arbitrary 30% move in spot price and 30 point increase in vol results in less than a $500 dollar loss. I feel comfortable placing this trade knowing that even a historic move like this shouldn’t impact my portfolio too much.
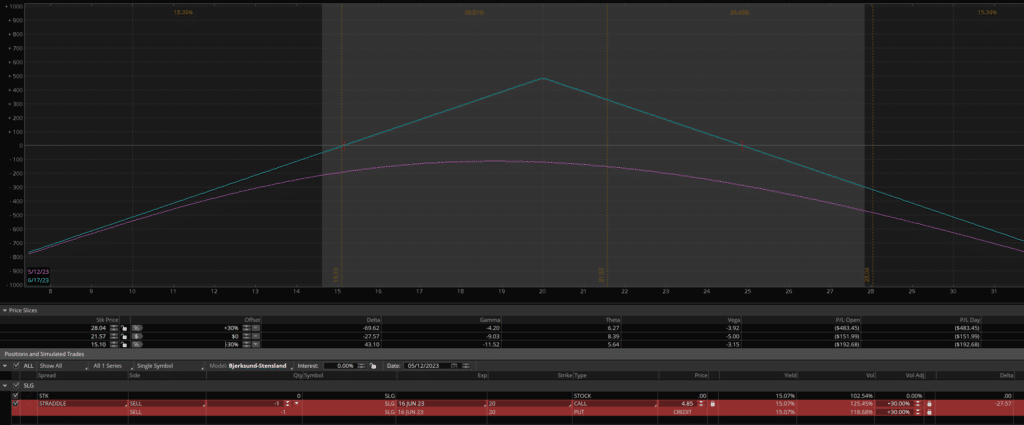
As for position management, I would continue to hold this trade if SLG realizes less volatility than implied. If we start to see multiple days in a row of outsized moves, I would cut the position early, even at a loss. Of course, if implied volatility drops, we can get out once the edge is gone.
Conclusion
I want to reiterate that this is just one of many trades that should be a part of a short-vol book. The research is solid, but the edge that it gives us is not enough for “Let’s yolo our life savings.”
So trade it small; find many similar trades to spread your risk!
Good luck, and happy trading.