Article Summary
- Gamma scalping is a trading strategy that involves buying a straddle, and then delta hedging it. This approach allows traders to benefit from stock movements in either direction by purchasing shares when prices drop, and selling them when they rally. The best time to gamma scalp is when the implied volatility of an option is lower than what you expect realized volatility will be in the future.
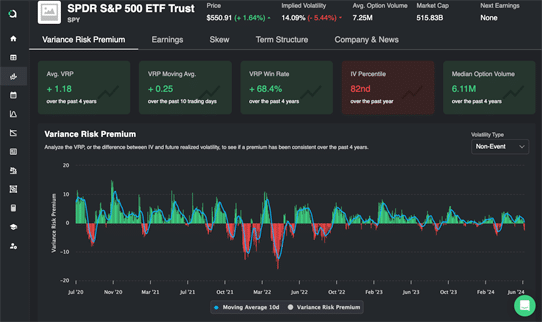
- Unlike stocks, where the past does not predict the future, traders can forecast future volatility based on historical data. This is because volatility tends to cluster in the short term but revert to the mean in the long term.
- Relative Value trading involves comparing two different assets together; rather than determining if the implied volatility is too high or too low based solely from historical data, we can look at the relative pricing between similar stocks.
Introduction
Volatility trading is a type of options trading that uses market volatility to make a profit. Instead of betting on the direction of a stock, they bet on how big the fluctuations in market price will be. For many market makers and quant funds, volatility trading is the core of what they do. In this article, we will explore volatility trading, why many prefer trading volatility over the direction of stock prices, and how you can get started with your volatility trades.
Review of Implied and Realized Volatility
Implied and realized volatility are two types of volatility important to understand when trading options. Implied volatility is the expectation of future volatility based on the current price of an option contract. This implies that the market expects a certain price movement in the underlying asset. On the other hand, realized volatility is what happened in the past or present when measuring actual price movements in an asset.
Implied volatility can be estimated using various option pricing models such as Black-Scholes and Binomial tree models. By combining these models with price and time data during a particular period, implied volatilities can be calculated. Since implied volatilities change with respect to changing market conditions, traders need to monitor them closely.
Realized volatility, however, measures how much an underlying stock has moved from one period to another over a given period. This analysis is done by calculating the standard deviation of daily returns for a security over a given period. It’s important to note that realized volatility does not consider any expectations about future movements but focuses on historical data from previous periods only.
In summary, implied volatilities tell us what market participants expect regarding future movements. In contrast, realized volatilities show us what kind of price movement we have seen historically in a given security or asset class over a certain time frame. Both are important measures to consider when trading options.
Gamma Scalping
When an option is long Gamma, a delta-neutral position will make money if the stock moves in either direction enough to offset the cost of Theta. Gamma is the basis for all volatility trades.
Gamma scalping is a trading approach that involves buying an options straddle at-the-money (ATM), then delta hedging it. This process requires the trader to purchase stock when prices drop and sell them once they rally. It sounds like a great idea considering that traders can buy low and sell high.
To illustrate, let’s assume that a trader buys an ATM straddle, and the stock price subsequently falls. They would be making some money since the straddle now has negative deltas. However, this also increases directional risk, meaning they would lose out if the stock rallies afterward. To counteract this, delta hedging is used by purchasing shares of stocks. This would return their portfolio to 0 Delta.
If the stock rallies, the straddle will also become ATM again and has no delta. Nevertheless, they are still holding stocks, which allows them to make some money in their overall position, and they can now sell off the shares at a profit. On the other hand, if the stock doesn’t rally but instead continues its downward trend, losses will have been incurred on the stock position itself – although not all hope is lost. Because the straddles will have more negative delta, the trader can make money on their overall position despite any losses from their stocks.
In conclusion, gamma scalping is essentially taking on a long volatility trade where more movement from stocks means greater chances for profits for traders. The downside is that to gamma scalp, traders have to pay theta every day they hold a long options position.
When to Gamma Scalp
When is gamma scalping most profitable? The answer is closely related to implied volatility (IV). Ideally, a trader should buy an ATM straddle when IV is lower than what you expect realized volatility will be in the future. When IV is low, option prices will be low as the market does not expect much volatility in the future. When the options are too cheap, we’re paying minimal theta to profit from gamma scalping. When the realized volatility of the stock is higher than the market’s expectation, profits from gamma scalping will outpace your theta costs.
On the other hand, when implied volatility is higher than your expectation of future stock volatility, it is usually better to avoid gamma scalping as the options will be very expensive. Rather, reverse gamma scalping might be a profitable trade. This involves selling at-the-money straddles and buying stock to delta hedge. While reverse gamma scalping, hedging will cost the trader money over time since they have to hedge by buying stock when prices increase and selling stock as prices fall. However, selling expensive options (where implied volatility is higher than expected future volatility) will ensure that the theta received overcompensated for these short gamma losses.
Valuing Implied Volatility
The level of implied volatility determines whether it’s time to pay or collect theta. We can guess whether IV is too high or low in different ways:
Absolute Valuation
Understanding Volatility Clustering
Valuing Implied Volatility is a key factor for traders and investors to assess when deciding whether it’s time to pay or collect theta. By understanding two essential volatility characteristics – that volatility clusters in the short term and mean-reverts in the long run – investors and professionals can estimate future volatility using historical data.
Volatility clustering describes the tendency for markets to ‘cluster’ together with heightened levels of fear or excitement that drive prices up or down over a short period. Typically, these periods are preceded by longer stretches of low volatility that allow for more orderly price movements. External factors, such as the release of economic news or earnings data, often drive the occasional bursts of volatility. High volatility could be attributed to certain macroeconomic events — such as political developments — which cause investors to become excited (or fearful) and rush into (or out) of positions, driving prices up or down in sudden bursts.
Because of volatility clustering, it is common for option traders to use historical volatility as one predictor of future volatility. During periods of low volatility, the stock price will likely remain stable, barring some fundamental data or earnings announcements. During periods of high volatility, investors are likely to continue speculating on the direction of stock prices, pushing prices around. Two (of many) popular historical volatility measures include the close-to-close volatility estimator and the Yang Zhang estimator.
Close to Close Estimator
The Close to Close Volatility Estimator measures the volatility of an asset or market using only the closing prices of the period being evaluated. It is a simple but often effective measure for measuring the volatility of an asset. The basic idea behind this approach is to calculate the standard deviation of an asset’s daily return over a certain period. Brokers will usually provide Close to Close estimates of several different timeframes; for example, Interactive Brokers provide a 10-day Close to Close volatility estimate and up to a 200-day estimate. This standard deviation is then converted into an annualized volatility figure.
Yang Zhang Estimator
The Yang Zhang estimate is a volatility estimate that overcomes bias due to the discrete sampling by accounting for the opening jumps in price. Yang Zhang utilizes open, high, low, and close data (OHLC), accounts for the fact that some stocks trend in one direction, and considers overnight and intraday volatility. Yang Zhang is extremely efficient compared to Close to Close, and can estimate volatility with significantly fewer data points. The Predicting Alpha terminal uses the Yang Zhang estimate for realized volatility.
Understanding Mean Reversion
The mean reversion of volatility is an important concept for investors and traders to understand when determining the future direction of market movements. Volatility can be highly variable in the short term but tends to return to its long-term average over time. This phenomenon is known as the mean reversion of volatility, which can have significant implications for investors who seek to maximize returns while minimizing risk in their portfolios.
Mean reversion of volatility also has implications for investors who employ options strategies such as selling options (also called writing options). When implied volatility is relatively high compared with its historical average, it may make sense for option sellers to collect option premiums from buyers due to excessively high expectations of future price swings, even if, in the short term, volatility may stay high due to clustering.
What is Garch?
GARCH is a popular volatility estimator which forecasts volatility based on the fact that volatility clusters in the short term but also tends to revert toward the mean. A GARCH forecast of future volatility can be calculated by combining a weighted average between realized volatility and the long-term mean.
Relative Value Volatility Trading
Relative Value Volatility Trading is a trading strategy commonly used by investors to take advantage of price discrepancies between assets. By trading the relative value of two assets, traders can use one asset as a hedge against another.
The concept of relative value volatility trading is based on the idea that different assets will have different levels of volatility over time. When these assets are compared to each other, an investor can identify the relative prices of their options. For example, if TSLA and JPM had the same implied volatility, traders would buy TSLA options and sell JPM options. Since TSLA is nearly always going to be more volatile than JPM, traders know that TSLA options are undervalued, and JPM options are not.
At its core, relative value volatility trading seeks to find mispriced securities and take advantage of them by buying one asset low and selling the other high, rather than trading one asset on its own. Common relative value trades include analysing an ETF’s implied volatility compared to the IV of its constituent stocks, comparing implied volatilities of companies in similar sectors, or even analyzing options within the same chain with different strikes or days to expiration.
Conclusion
There are a lot of different ways to trade volatility using options. However, by understanding gamma scalping, absolute valuation, and relative valuation, traders can build their own trading strategies and develop good trade ideas.
Interested in 1-on-1 coaching for your options trading? Click here to book a free session with me!

