
We are very excited to release 5 new metrics that will help you measure the Variance Risk Premium for any ticker.
Along with this update comes a methodology that is based on building a solid foundation for your portfolio, then spending time looking for unique situations that offer outsized returns.
Some background information on this update
This is based on our recent findings related to forecasting volatility, in which we discovered that traditional methods such as time series modeling no longer offer the same edge that they once did.
The modern approach to volatility trading involves a couple of steps:
1. Identify that a Variance Risk Premium generally exists.
2. Confirm that the Variance Risk Premium is currently present.
3. Determine if the current volatility regime is normal for the ticker you are analyzing.
If these three conditions are true, then the ticker you are analyzing is a good candidate to be added to your volatility portfolio.
New Methodology Explained
You can think of the new methodology as a “trading food pyramid.” We start with our basics that everyone should include, and as we move up the pyramid, we begin looking for more unique (and complex) situations, which intrinsically offer better returns.
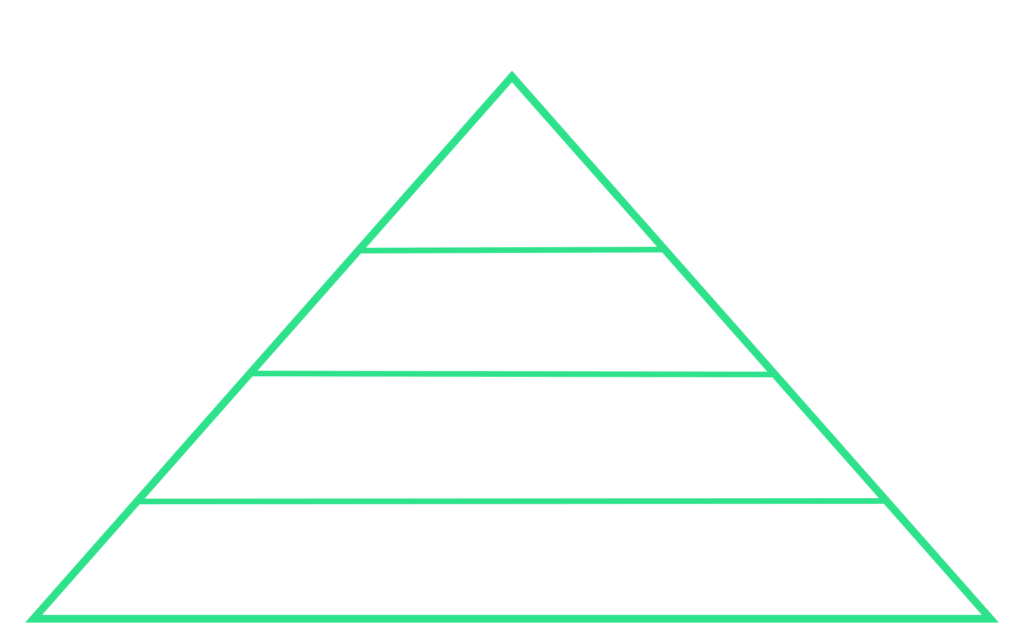
In the analogy of treating your trading like a business, the base of the pyramid represents the activities you do to “keep the lights on and pay the bills,” while the higher activities are what “push your revenues beyond your forecasts.”
Level 1: Collect VRP from ETFs
This involves selling 30 DTE, at the money volatility on the ETFs with the richest variance risk premium. Our new scan, called ETF Variance Risk Premium, ranks ETFs for you so you can know which ones to add to your portfolio.
This is something that all members (new and old) should be including in their volatility trading.
Level 2: Trading Events
Immediately following harvesting VRP from ETFs, the next area where it is most available to us retail traders is by trading volatility around events. The most popular event traded by PA members is Earnings. These trades can offer outsized returns because of the event risk and are a great next layer to your portfolio.
Level 3: Single stock volatility
Once you are comfortable with trading around events, it’s time to start exploring the world of individual companies. This requires a bit more research, but at a fundamental level, you want to find tickers that have had a persistent risk premium and understand what is driving it.
A new scanner has been added to help you find these opportunities.
Level 4: Arbitrages and distressed volatility situations.
This is by far the most complex. It involves your own creativity and a strong understanding of volatility trading. Once you have a portfolio of the first 3 levels up and running, your time will be spent searching for these types of opportunities. For example, you might explore the world of IPOs, relative value, and beyond.
Feature Changes Explained
New Scans to help you in your search
There are two new scans available, which show you the top candidates for collecting VRP from (1) ETFs and (2) Stocks.

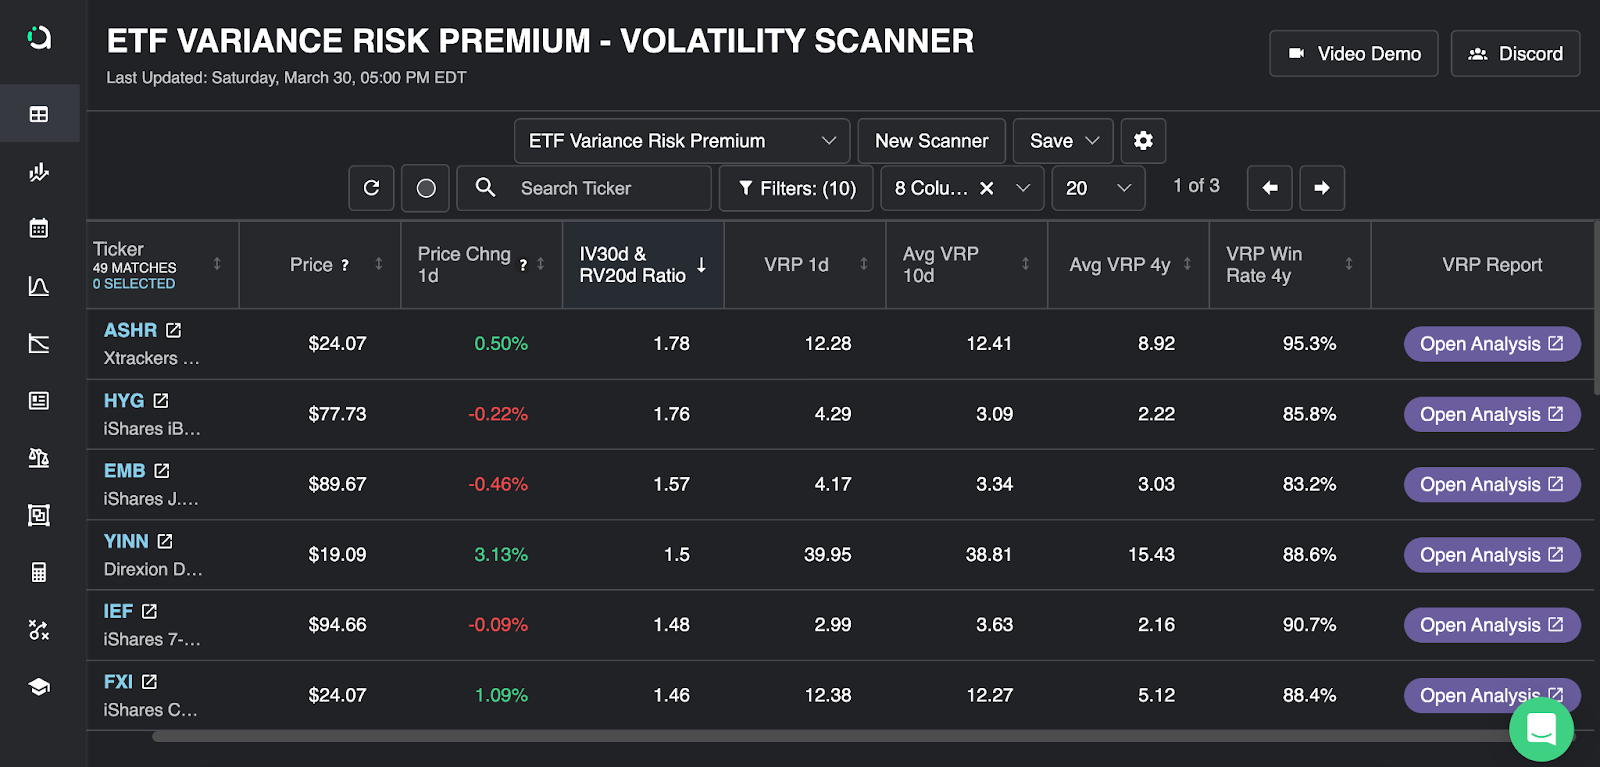
ETF Variance Risk Premium
The ETFs that appear on this list are good candidates for selling 30 DTE straddles and delta hedging them to extract the risk premium.
The basis of every good volatility trading portfolio is harvesting risk premiums. This scanner filters for the ETFs that have a positive long-term VRP (based on the past 4 years) and that have been positive recently (based on the 10-day VRP moving average).
Stock Variance Risk Premium
The Stocks that appear on this list are good candidates for selling 30 DTE straddles and delta hedging them to extract the risk premium.
The filtering process is the same as for the ETF VRP scan, except it looks for stocks instead of ETFs.
Premium Tracker Replaced with Variance Risk Premium tracker
In line with our move away from time series analysis to measuring VRP, the premium ratio has been replaced with our Variance Risk Premium tracker.
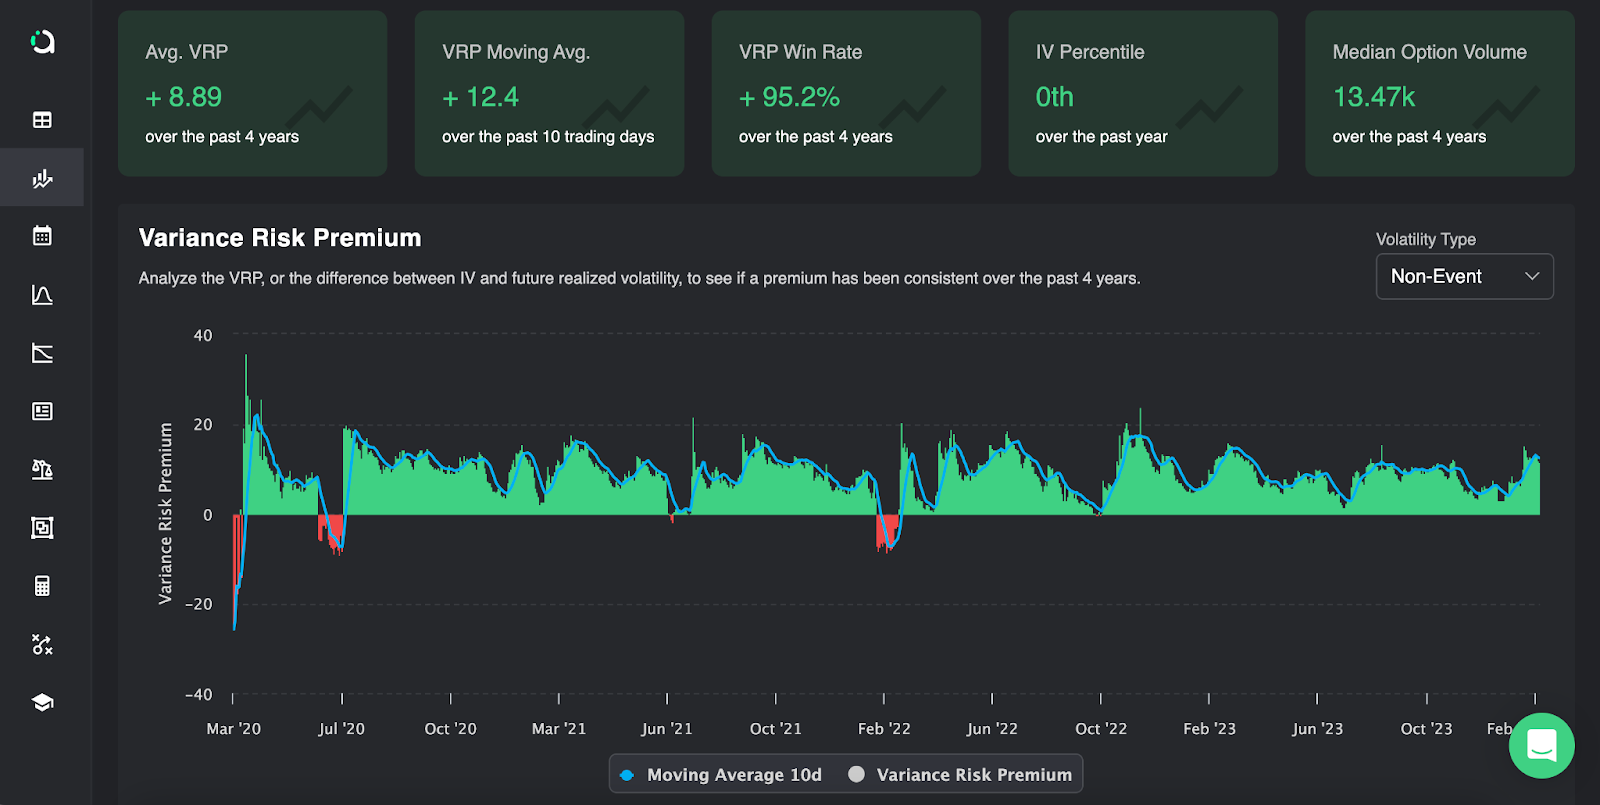
This chart and its scorecards are pretty much the only thing you need to get a sense of if there has been a persistent risk premium for a ticker.
The chart itself shows you the 30-day implied volatility for each day compared to the future 30-day realized volatility, allowing you to directly compare if the implied volatility was greater than the realized volatility it was trying to forecast.
The chart shows you the data for each day over the last 4 years, along with a moving average.
There are 5 key metrics that we use to measure the variance risk premium for a ticker.
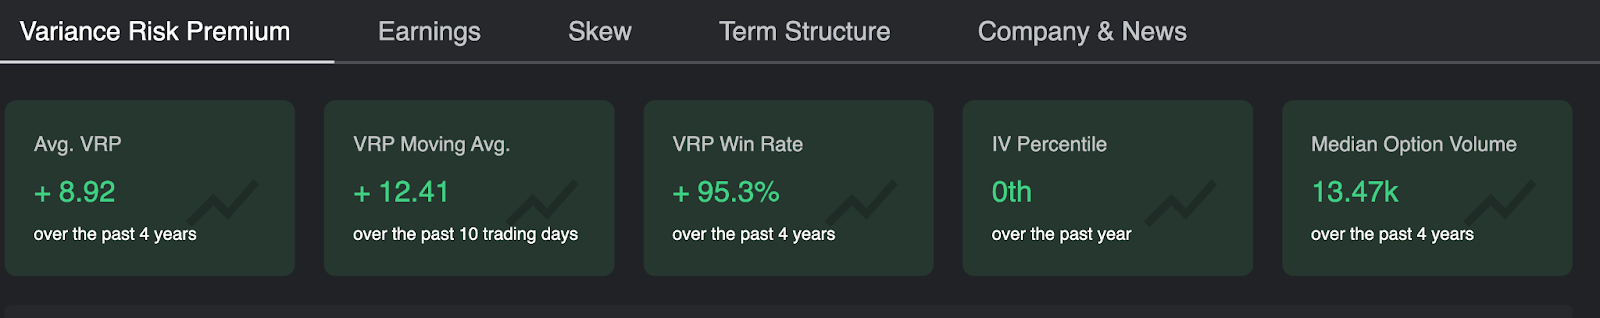
– Average VRP
– VRP Moving Average
– VRP Win Rate
– IV Percentile
– Median Option Volume
Questions they help us answer
1. Is there a risk premium present in this asset, and how big is it?
2. Is the risk premium present currently?
3. Is the risk premium persistent over extended periods of time for us to monetize?
4. Is volatility behaving in a normal range, or are we in a period of extreme volatility?
5. Have options been liquid enough for this ticker for us to have reliable data to run this analysis?
The scorecards change color to help guide your decision-making. If they are green, it means that the answer to the question is “yes”. If red, the answer is “no”.
Ideally, we trade tickers where we see all scorecards are green, but keep in mind that you should include your own discretion beyond this to make the best decisions.
Between the new scanner and Variance Risk Premium page, you are now equipped with everything you need to analyze risk premiums for ETFs and Stocks like a pro.
Up Next
In the coming weeks, we will be releasing a Macro Volatility Page, which will help you get a sense of general volatility changes in the market. After that, we will be releasing brand new education that dives deep into the trading methodology described in this article so you can trade it with confidence.
If you have feedback, please reach out to us on Discord or send us an email by contacting sean@predictingalpha.com.
Happy trading,
Sean & the PA Team.