
When I first learned about options, I, like many other options traders I see on Reddit, would more or less blindly sell covered calls, cash-secured puts, and credit spreads on high IV stocks. Like many other traders I saw on Reddit, I lost a ton of money. However, I got lucky.
Several years ago, I met a vol trader and Predicting Alpha member called Steven through Reddit. I knew that I was just a beginner trader at the time, but the way he talked about options and volatility showed me how little I really understood. He later invited me to the PA community. There, I met many knowledgeable traders, including u/AlphaGiveth, the author of “The Ultimate Guide To Selling Options” on r/Options. They blew me away.
Want to check Predicting Alpha out? You can sign up through this link.
Not convinced yet? Keep reading.
The first thing that impressed me was their data terminal, which let me visualize data, scan, and analyze potential trades.
The Predicting Alpha terminal has three trade dashboards and seven trade analysis tools. The trade analysis tools are for those looking for their own trades and want to simplify their quantitative analysis. The dashboards, however, are simple, customizable scans that help traders of all experience levels look for good trades.
The Volatility Dashboard
The volatility dashboard helps traders scan for stocks where implied volatility may be too cheap or expensive.
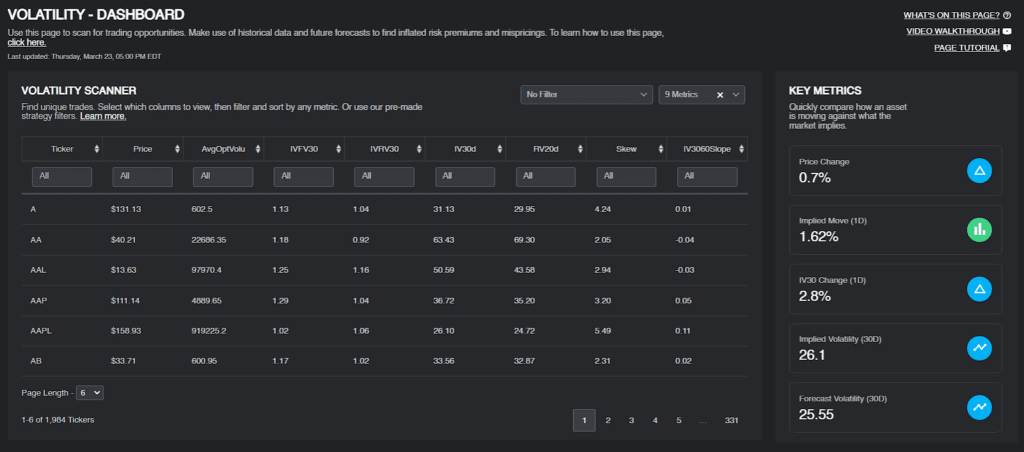
This is an excellent tool to scan for stocks with high implied volatility relative to their historical volatility. While this is a feature that some brokers offer, the Predicting Alpha scanner can filter for things like upcoming earnings events, stocks without weekly options, or stock options with insufficient volume. There’s a total of 25 different metrics traders can scan or filter for here.
This trade scanner is the bread and butter of many volatility traders. This tool helps traders identify stocks with elevated IV in minutes, saving them from wasting time building their own scanners or manually looking for trades.
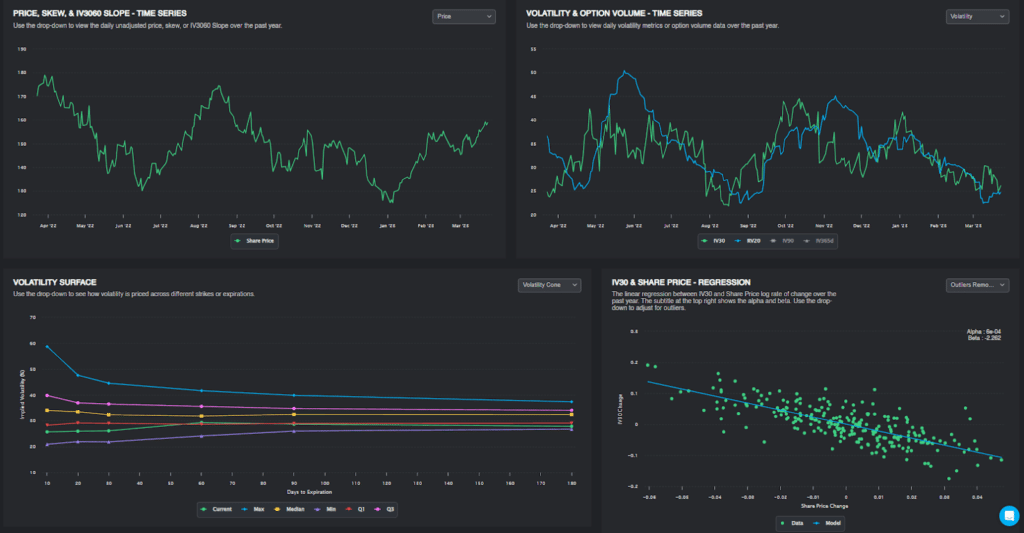
Also on this dashboard are a lot of graphs of price, volatility, skew, and other metrics so that traders can spot mispriced options with just a quick look. Here you can see if the term structure is implying a major event next week or if the skew is pricing in a violent drop in stock prices.
Earnings Insights
This earnings dashboard is for everyone who likes to trade options around earnings events. Many strategies revolve around earnings; options are much more likely to be mispriced during these events. Institutional funds need options to hedge positions, market makers are unhappy about the risk of earnings jumps, and retail traders love punting money by speculating on quarterly results.
Academics have long documented a phenomenon where options are too cheap a week or two before earnings but become too expensive around the earnings event.
We can build strategies that collect a jump risk premium over earnings or “front run” options demand around earnings a week or so before the event. This dashboard provides you with the information you need to evaluate earnings trades.
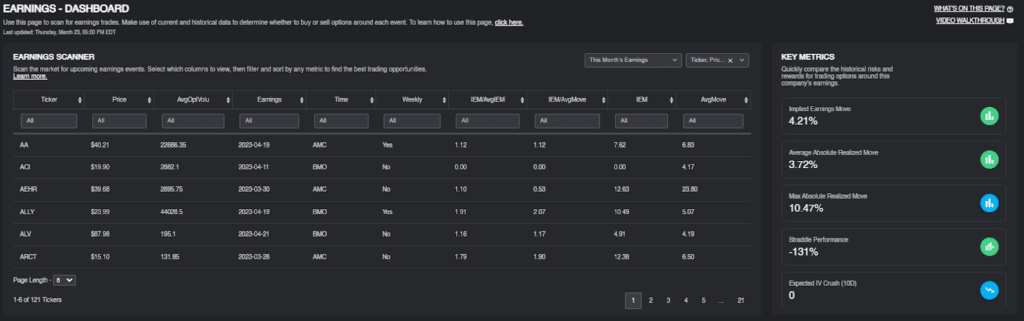
The dashboard provides you with data on the stock’s current implied move, historical implied moves, and the actual moves the stock has made in the past. The dashboard also helps you calculate expected IV crush, screen stocks by industry (I personally don’t trade biotech), and even backtests the results of buying/selling options before earnings.
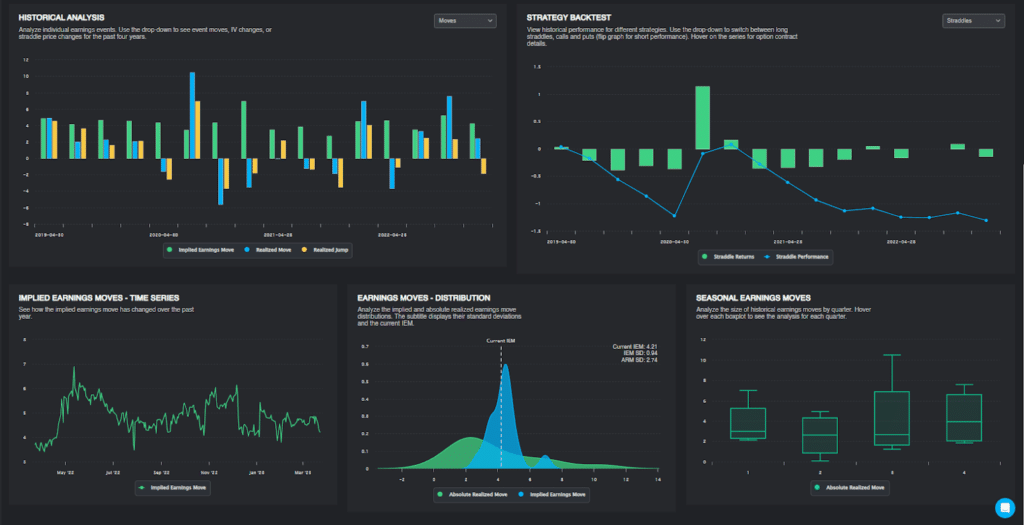
All this information is available to you in the form of intuitive graphs.
The Forward Volatility Scanner
The forward volatility scanner is my personal favorite. This scanner can help us find stocks with steep term structures. This allows us to put on profitable calendar trades. Oftentimes, a stock has a steep term structure because it’s pricing in a large move in the near term. As a result, these short-term options trade become overpriced as nobody wants to hold risk. We can sell these short-term options and buy longer-term options as a hedge. On the flip side, if long-term options are expensive, we can sell them and buy short-term options to hedge.
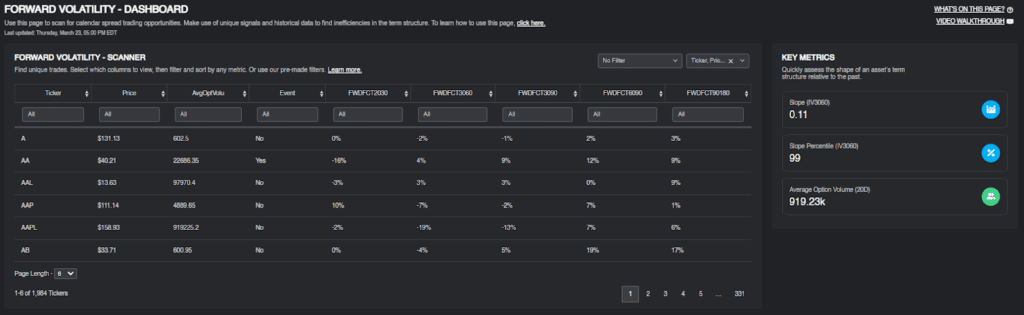
What’s nice is that the terminal calculates a “forward factor” that measures the amount of contango/backwardation in each stock. This was used as an indicator to take trades in Jim Campasano’s paper studying calendar trades. Of course, you can use many other metrics if you don’t want to use the forward factors.
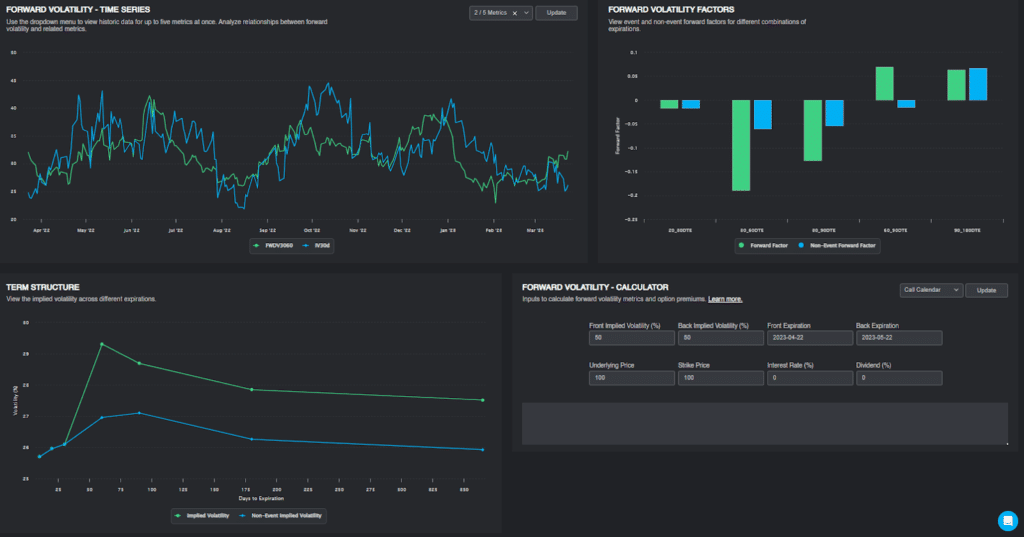
As with all the other scanners, there are charts to help you visualize the term structure and other data.
The Relative Value Analysis Tool
The relative value analysis tool is a sandbox for traders who want to find their own trades outside of our scanners. Traders can graph almost anything we have data for.
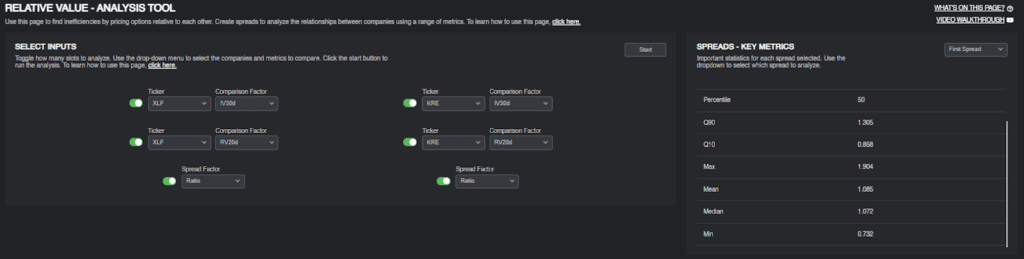
The simplest graph would be a stock’s implied volatility versus realized volatility. However, we can go a little further. What if we wanted to graph the ratio of IV and RV?
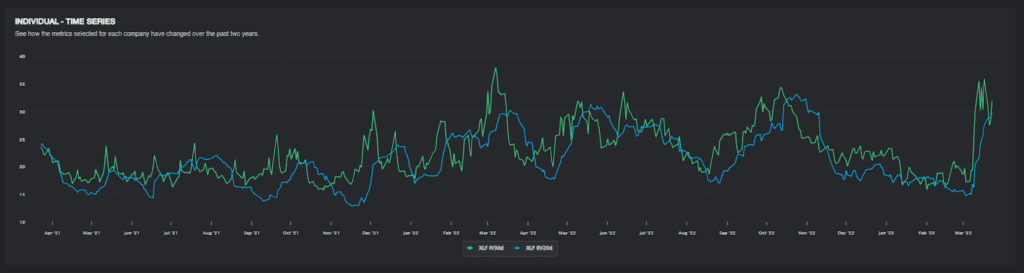
What if we wanted to compare the IV/RV ratio of two stocks?
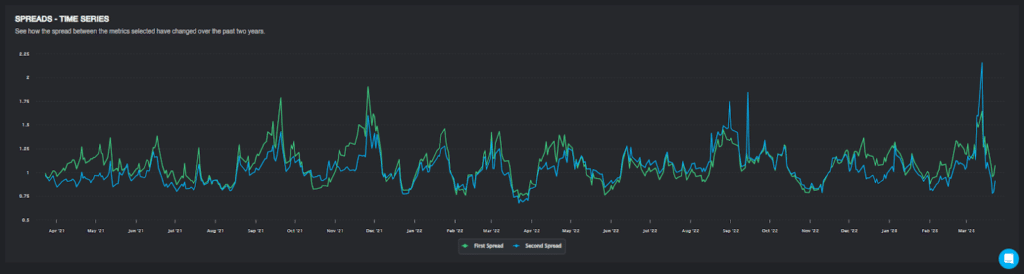
We can do that too. This graph shows the IV/RV ratios of XLF and KRE. Seems like XLF options are a little more expensive than KRE. This is weird since KRE has a greater concentration of regional banks that are taking a dive.
Use the relative value tool to analyze whatever you like!
What Else Is There?
Education
The education in Predicting Alpha is top-notch. The program includes interviews, trade examples, and lecture videos. There’s even a required reading list, which includes Natenburg’s Options Volatility & Pricing and Euan Sinclair’s books.
I’m not gonna lie to you; the production quality of the lecture videos is terrible. But the content’s really good.
Community
One big advantage that institutional traders have over retail is a community. They bounce ideas off each other and learn from each other’s mistakes. Predicting Alpha has a discord for its members where we share trade ideas and ask each other questions. We’re not a signal service, but sometimes members share their own trades that turn out really well.
Now what?
I’m now the community manager at Predicting Alpha. I help moderate the community, talk about new trade ideas, and write about what I’ve learned at PA.
Try an extended free trial at Predicting Alpha! You’ll get 30 days free, a 50% discount, and a money-back guarantee. If you don’t like us after six months, we’ll give you a refund.
Want to talk about it before trying us out? Book a call with me here.
Good luck, and happy trading!