This post will dive into one of the most important concepts in options trading. Understanding this concept will change the way you think about options trading (for the better). The concept is called volatility.
As an option trader, you are expressing a view on volatility… Some know this and others don’t.
Because options expire, we now have to be aware not just of the direction the stock will move, but by how much it will move in a given time period.
Example 1: Comparing Two Stocks
Let’s say we are looking at $AMC and $KO (Coca-Cola) and want to compare how each of these stocks moves over a 3-day period.
If we look at KO, this is a company that has been around for a long time. We understand how much money they make, how they make it, what their future revenue is likely to be, etc. So, on a day-to-day basis, we shouldn’t expect massive swings in the stock price.
For instance:
- Day 1: +1%
- Day 2: -1%
- Day 3: +2%
But what if we looked at AMC?
From what we know about AMC, it moves a lot. It could move up 10% one day, down 15% the next day, and then back up 20% on the third day!
Considering these two stocks, it’s clear that KO is much more stable than AMC. There is a lot less risk associated with KO than with AMC.
Comparing Options Costs
Which of these stocks do you think would have more costly options?
AMC options would be more expensive relative to $KO because there is a higher risk that AMC moves significantly. Remember, the options market tries to price what is going to happen in the future. Since it is much more probable that AMC moves 10% tomorrow than Coca-Cola, AMC options imply more future big move risk than the options for KO.
Simple Explanation: Volatility and Options Pricing
In simple terms: AMC is more volatile than KO.
If both stocks were trading at $100 per share, we would expect a $100 strike call option on AMC to be much more expensive, given the higher likelihood of significant price moves.
Remember, in a trade, there is a buyer and a seller. If an option on AMC was priced at only $2, everyone would want to buy it, and no one would want to sell it. This imbalance in supply and demand would drive the price up.
Why Do We Care About Volatility?
Volatility is crucial because it is the key factor the market uses to determine how much options should be trading for.
Most retail traders are price insensitive in the options space. They focus more on the exposure options provided rather than their cost. However, as we progress through this lesson, it’s essential to start thinking about the value of options.
If we can find an option trading for $10 that is really worth $5, we’ve identified a great trading opportunity. So, let’s try to connect everything here back to the value of options.
Checkpoint Summary 1
- Volatility Definition: Volatility is simply the size of the move for a given stock.
- Factor in Option Pricing: A big factor in the price of options is how volatile the market thinks a stock will be in the future.
- Implied Volatility: Since volatility is a significant part of how the market prices options, we can say that the option prices imply future volatility.
- Volatility vs. Direction: Volatility is not about the direction of the stock’s movement; it is fundamentally about the size of the moves, not the direction the stock goes.
- Trading Volatility: If you are trading options, you are trading volatility. Understanding volatility is a crucial part of understanding how to trade options effectively.
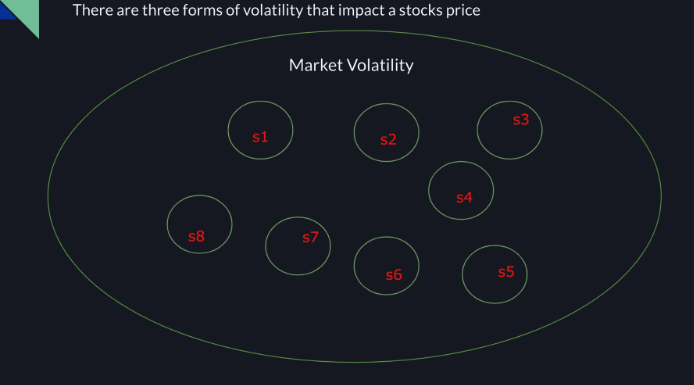
The 3 Circles of Volatility
Now that we understand what volatility is, we need to recognize that different forms of volatility impact every single stock. We created a visualization to help us understand this which we called the “3 Circles of Volatility”.
There are three forms of volatility that impact any given stock:
1. Market Volatility
- The market itself has volatility. All the stocks we examine exist within the broader market.
- If the market crashes, all the stocks we are looking at would also take a significant hit.
- The market overarches all the stocks we analyze, and what happens to the overall market impacts all of them.
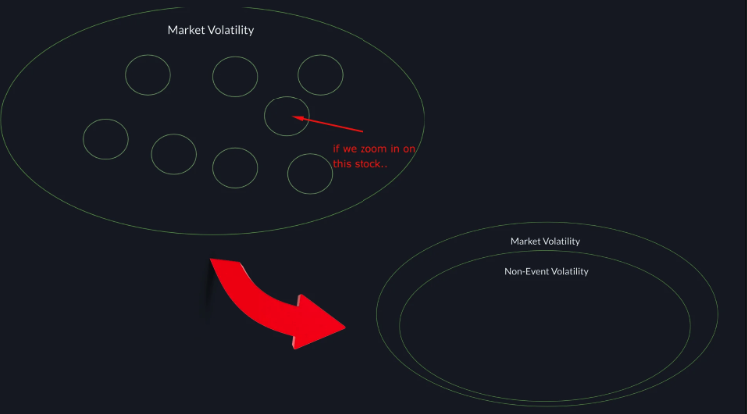
2. Non-Event Volatility:
- Different stocks exhibit different levels of non-event volatility. For instance, $KO will generally have less non-event volatility compared to $AMC, as different stocks move by different amounts regularly.
- When we focus on a specific stock, we encounter another form of volatility called non-event volatility.
- Non-event volatility refers to the regular day-to-day movement of a stock.
- This includes how the company has been performing and its average daily movement. For example, does it typically move 1% a day or 10% a day?
3. Event Volatility:
- When we zoom in further on a company, we identify key events that drive significant movements in the share price.
- Examples of such events include earnings announcements, product releases, and drug approvals.
- These company-specific events introduce new information into the market, often leading to sudden and substantial changes in the share price.
- As a result, events can cause short bursts of high volatility for a stock, which are not typically observed in its regular day-to-day movements.

Recap of the 3 Circles of Volatility:
- Market Volatility: The overarching volatility of the entire market that affects all stocks.
- Non-Event Volatility: The regular, day-to-day movement of individual stocks.
- Event Volatility: Significant movements in a stock’s price driven by specific events within the company.
Understanding the Impact of the 3 Forms of Volatility
By considering these three forms of volatility, we can better understand what causes stock movements and how they impact option prices.
- Market Volatility:
- Example: If the stock market crashes, this market volatility will overshadow the non-event volatility of individual companies. Even if a stock typically moves only 1% a day on average, a market crash could cause it to move significantly more.
- Non-Event Volatility:
- Example: When a stock like $KO usually moves 1% per day, this reflects its non-event volatility. This regular, day-to-day movement can be overshadowed by larger market events or significant company-specific events.
- Event Volatility:
- Example: Consider GME during its highly volatile period. Despite the extreme movements in its stock price, the event volatility around their earnings releases was almost the same as its non-event volatility. This indicated that no additional “event impact” was being priced in, as the stock was already experiencing high volatility.
Relating It Back to Options
When looking at an option expiring in 30 days, we must consider the three forms of volatility to understand how the market determines how much the stock is likely to move over that period.
Suppose the stock is trading at $100, and the at-the-money (ATM) call and put options are each priced at $5 (5% of the share price). By adding these together, we see that the “range” the market implies (the ATM straddle) is $10 in price, or 10% of the share price.
This indicates that the market expects the stock to move up or down by 10% in the next 30 days. The option prices are reflecting this market-implied volatility.
Now, let’s say there is an earnings event scheduled in the middle of those 30 days. We can now understand that market volatility, non-event volatility, and event volatility are all contributing to the “10% up or down” movement that the market is pricing into the options.
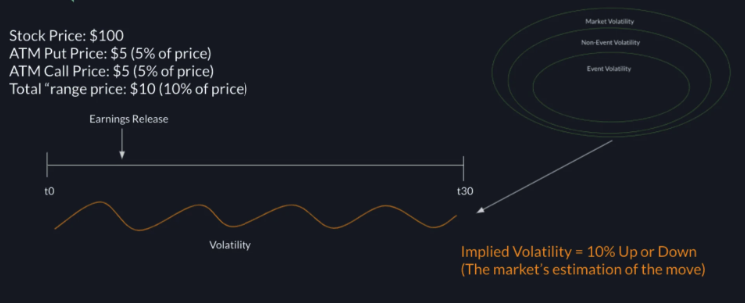
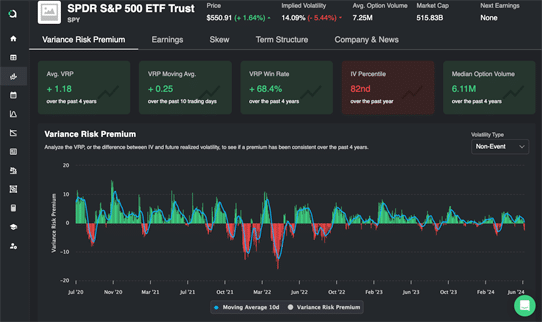
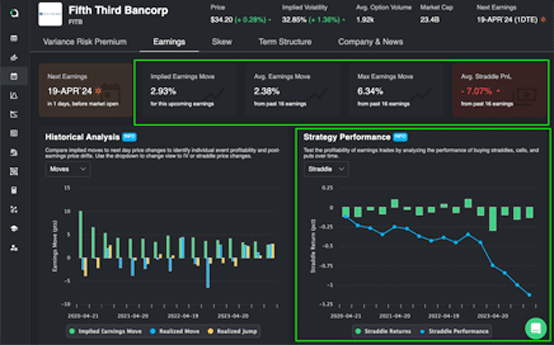
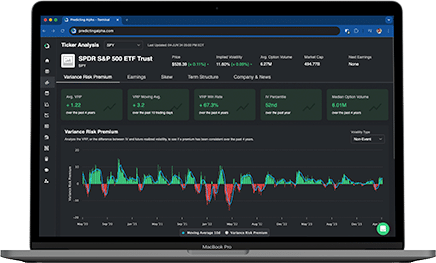
Why is this important? Knowing there’s an earnings event in the middle of the period, we can use the 3 circles to predict that much of the implied 10% move might occur on that day, with minimal movement on the other 29 days. Analytics tools can help separate event and non-event volatility, which is useful for selling options and understanding what you are selling.
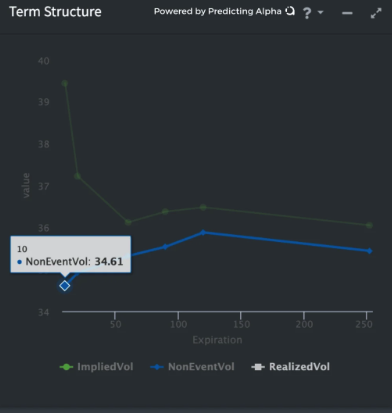
We can separate event volatility from non-event/market volatility. This helps us understand how much the market is pricing in for the event and how the value of options will change after the event passes.
The picture above shows the term structure for DAL and how much earnings event volatility is priced into the different DTEs (days to expiration), with earnings scheduled for this week.
A cool thing about the 3 circles of volatility is that we can isolate which one we want to trade. Depending on what you think is mispriced, you can focus on one form of volatility. For example, if you just want to trade an earnings event, you can structure your trade to minimize market and non-event volatility!
Checkpoint Summary 2
When trading stocks, it’s crucial to understand the three forms of volatility that can influence a stock’s price: market volatility, non-event volatility, and event volatility.
- Market volatility can be thought of as the “tide that rises and lowers all ships.” It refers to the overall market’s movements, which affect all stocks to varying degrees.
- Non-event volatility is the typical daily fluctuation in a stock’s price. This is the normal, expected movement that occurs as part of regular trading activities.
- Event volatility occurs in short, intense bursts due to new information entering the market, such as earnings reports, product launches, or other significant announcements.
The price of an option takes into account the impact of these three types of volatility over the option’s remaining days until expiration.
By understanding these different forms of volatility, traders can focus on isolating and trading the specific type of volatility that aligns with their strategy.
Implied vs. Realized Volatility: An Analogy
Consider yourself at a horse racing track, ready to place a bet on the upcoming race.
You check the odds and see that a horse named Seabiscuit has 4:1 odds of winning. Great! This means the market suggests that by risking 1, you could potentially win 4 if Seabiscuit finishes first. You analyze the situation and believe there’s a 50% chance of Seabiscuit winning (while the market implies only a 25% chance), so you decide to go for it and place your bet.
As the race begins, Seabiscuit makes a strong start but eventually finishes in fourth place. Unfortunately, your bet didn’t pan out.
When you placed your bet, the market provided an implied probability of Seabiscuit winning. This is akin to the implied volatility in options trading, where the market indicates the expected future volatility of the stock.
However, the race’s outcome is the realized result—Seabiscuit did not win. This is similar to realized volatility in the options market, where the actual volatility experienced over a period can differ from what was initially expected.
Understanding the difference between implied and realized volatility is crucial in options trading, much like knowing the odds and the actual outcome is essential at the racetrack.
Implied volatility is how much the market thinks the stock will move in the future.
Realized volatility is how much the stock actually ends up moving.
How the Market Determines Implied Volatility
To grasp how the market determines implied volatility, imagine participants evaluating three main factors: market volatility, non-event volatility, and event volatility. Each of these factors influences the stock’s price between now and the option’s expiration date.
When the actual stock movement exceeds the implied volatility, buyers profit. Conversely, if the stock moves less than implied, seller’s gain. While this explanation simplifies the concept, it captures the essence.
To analyze the difference between implied and realized volatility, various tools are available (hint: the Predicting Alpha Terminal is pretty good for this).
For instance, the IV/RV ratios for stocks like $KO and $AMC can be examined using these tools to gain deeper insights into market expectations versus actual movements.
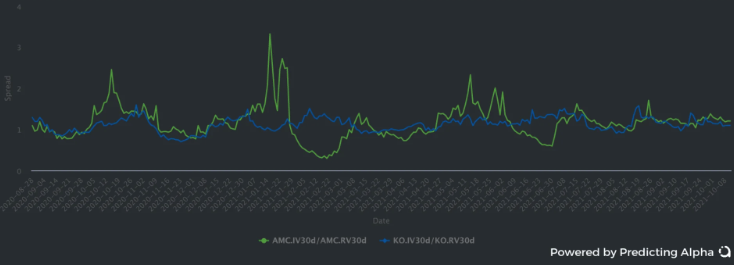
It’s quite interesting to observe the gap between implied and realized volatility for companies like $KO and $AMC on a single graph. This visualization clearly shows the difference, and it’s evident that both have stabilized to a similar spread over time.
Key Points Summary
- Implied volatility reflects the market’s expectations for the stock’s future movements.
- Realized volatility indicates the actual movement the stock experiences. If our predictions about the stock’s movements are more accurate than the market’s implied volatility, we have the potential to profit.
Deciding Which Side of the Trade to Be On
Understanding the market’s “bet” (implied volatility) versus what actually happens (realized volatility) is crucial, but how do we know which side of the trade to take?
Recall the horse racing example where you believed Seabiscuit had a 50% chance of winning, while the market implied only a 25% chance. This discrepancy is critical.
Why? Because it is the reason you would place the bet!
If you agreed with the bookie’s odds, there’d be no reason to bet. You know the bookie slightly skews the odds in his favor (check out my post on expected value for more details), so agreeing with the bookie’s odds would mean a bet with a negative expectancy.
In trading, the same logic applies. If you believe the market’s implied volatility accurately reflects the future, there’s no edge for you. However, if your analysis suggests a different outcome than the market implies, and you’re closer to the actual realized volatility, you have an opportunity to profit. The key is identifying these discrepancies and acting on them.
Developing a Forecast in Options Trading
The reason we took the trade in the horse racing example is because our forecast for the race differed from the market’s prediction. We apply the same principle in the options market.
The market offers options priced at specific implied volatility levels. Our task is to create our own forecast of future volatility.
Think of your forecast as your opinion on the stock’s future movement. If the market believes a stock won’t move much but you think it will, options are cheap. Conversely, if the market implies the stock will move more than you expect, options are expensive.
In most cases, forecasting volatility better than the market is hard. But we don’t always need to be doing that. Built into the market’s forecast is often something called the variance risk premium, which if measured properly, allows for option sellers to generate returns without needing to be able to see the future.
Conclusion
“Gold slips away from the person who invests gold into purposes through which they are not familiar.”
This quote from “The Richest Man in Babylon” often comes to mind when I see traders entering trades without a solid understanding of the products and markets they are dealing with.
Often, it’s this lack of familiarity that creates inefficiencies, which more experienced traders can exploit.
Remember, options are volatility products. Our goal should be to deepen our understanding of how these products are priced and to develop informed forecasts about future volatility. There is ample opportunity for retail traders to profit, but it all begins with a thorough understanding of the products we trade and the strategies we use.