In this article you are going to learn about the term structure of an option chain, what it tells us about the market expectations for volatility and how we can use it to make better trading decisions. We took all of the key information you need to take action and compiled it for you into a single article.
Key Takeaways
- What the Term Structure Says: It tells us how much volatility the market expects over different time periods and if the market expects there to be more or less volatility in the future.
- Different Term Structure Shapes: The term structure is typically in one of two shapes: contango and backwardation. Contango is what we see in “normal” market conditions. Backwardation is what we see when there is a high level of realized volatility right now.
- Term Structure Highlights Where Events Are: When you see a spike on one of the expirations, it usually means there is an event such as earnings, product releases, etc around that point of time in the future.
What is Term Structure?
Do you remember in our earlier blogs when we talked about skew? The concept that told us about how implied volatility changes across different strikes? Skew is one part of what we call the volatility surface, which is the concept for how implied volatility changes across all available option contracts for a ticker.
There are two parts that make up the volatility surface.
- The skew, which looks at changes in implied volatility across strikes
- The Term Structure, which looks at changes in implied volatility across expirations.
The term structure is a way for us to visualize how implied volatility changes across time. For every ticker that has option contracts available, there will be a number of different days to expiration available for us to trade.
When it comes to implied volatility and the price of options, the market determines these things by trying to forecast how much a given stock price should move in the future.
It may be expected that a stock moves a lot in the short term, and not so much in the long term.
Or it may be the opposite, where the market expects a stock to move less in the short term, and more in the long term.
These insights and more can only be interpreted by visualizing the term structure.
What Does The Term Structure Look Like?
Here is a rather crude drawing of what the term structure generally looks like.
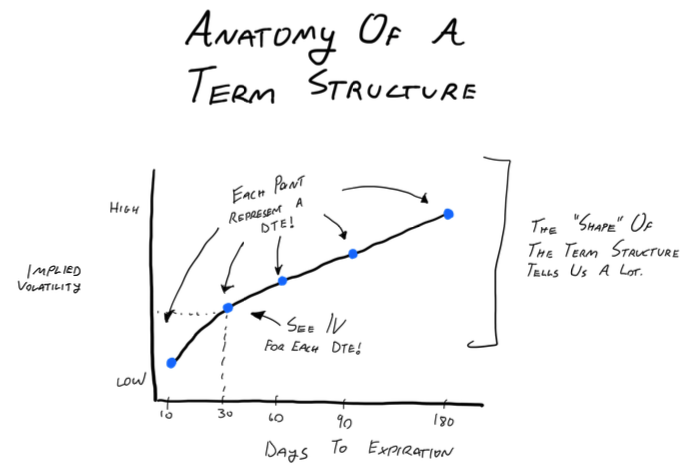
It should be pretty straightforward to understand what is being displayed to us. For each expiration we are being shown the at-the-money implied volatility. By putting them all on the same chart, we can derive insights about how the market expects the volatility of the underlying stock to be over different time periods.
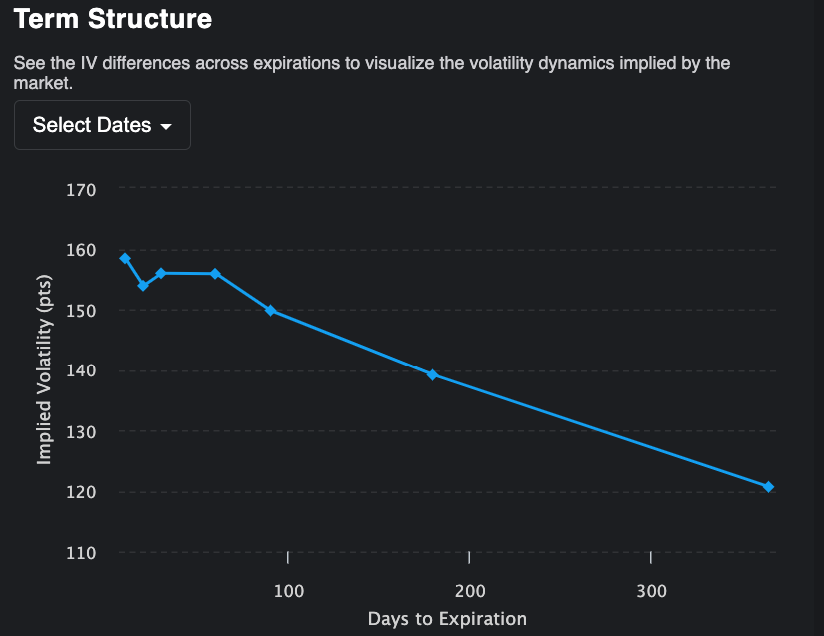
To bring things closer to reality, here is what the term structure looks like for SPY on a regular day.
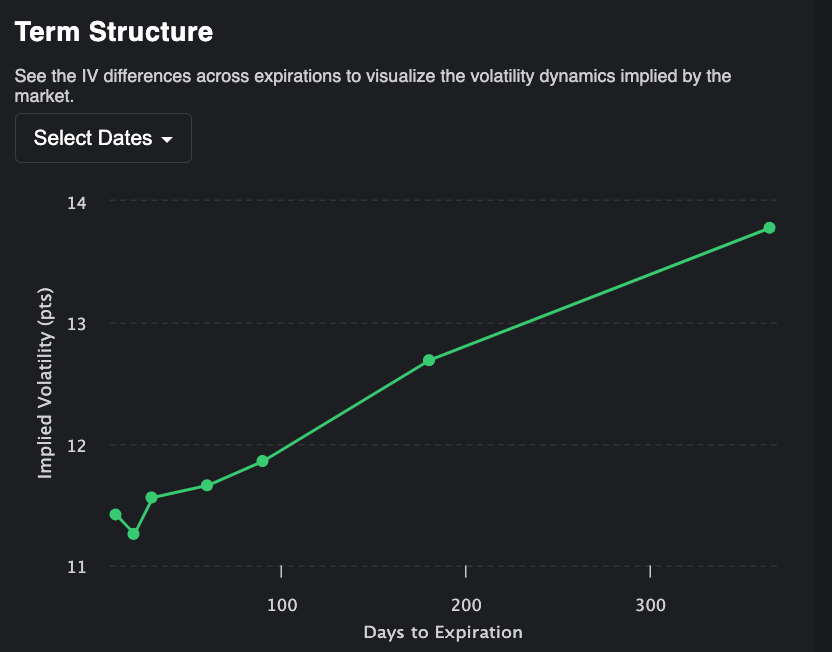
Assuming the world isn’t coming to an end, this is what traders should expect the term structure of SPY to generally look like. The shorter day-to-expiration options typically have a lower implied volatility than the longer day-to-expiration options.
Want to guess why?
Understanding Term Structure in Different Market Conditions
“Normal” Volatility Situations
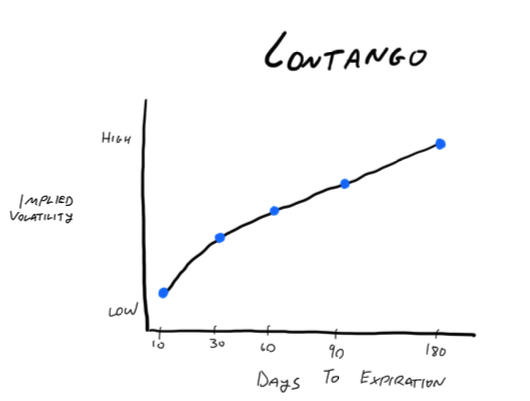
During periods when volatility is normal or low, the term structure takes a shape that we call “contango”. When the term structure is in contango, it means that the expirations with less days to expiration have lower implied volatility compared to the longer days to expiration options. This tells us that the market’s expectation is that implied volatility should increase over time.
This makes sense because if implied volatility is on the lower end of the range in which it oscillates, it makes sense that the market would anticipate some degree of increase in the future, as a way to bring us closer to the “mean” implied volatility that the implied volatility moves around. If you recall from our article about volatility characteristics, mean reversion is one of the well known behaviors exhibited by volatility.
Example: S&P 500
Most of the time the S&P is in contango. The term structure would look something like this:
- Near-term options (e.g., 10 DTE) have low IV.
- Long-term options (e.g., 1 year DTE) have higher IV, closer to the historical mean of around 15.
High Volatility Situations
During times when the current level of volatility is high, it is realistic for us to expect that volatility will continue to be high in the short term. But it is also reasonable for us to think that as time goes on, the level of volatility that we see should start to come back down to “normal” levels. The market is pretty smart, so option prices will typically reflect this too.
When the term structure shape shows us that shorter dated expirations have a higher implied volatility than the longer dated expirations, we call this “backwardation”.
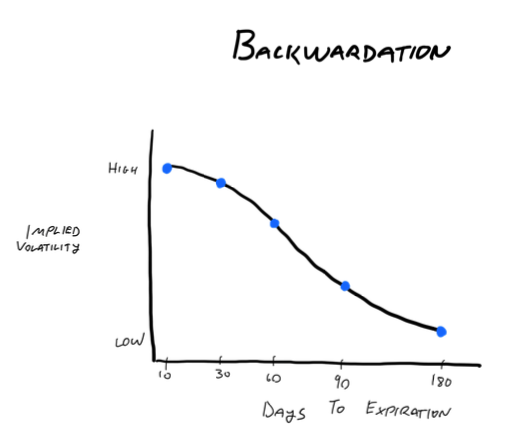
Example: Gamestop During Most Recent Spike
Recently Gamestop has seen some massive moves. Every day there were huge changes in the share price and everyone was buying up options trying to get a piece of the action. If we look at the term structure for gamestop back in June 2024, here is what we would see:
- Near-term options (e.g., 10 DTE) have very high IV.
- Long-term options (e.g., 1 year DTE) have lower IV.
This is an example of backwardation. The shorter days-to-expiration options have a much higher implied volatility than the longer day-to-expiration options. This makes sense in this type of situation.
One of the things we learned when we covered volatility characteristics is that volatility clusters. This means that when volatility spikes, it tends to stay high for a little while before it comes back down towards its mean. So it would make sense that the implied volatility would reflect that over the near term the stock will move a lot, but over a longer time horizon it should on average move less.
Term Structures Can Even Show Us Where Events Are Expected To Be
Sometimes when you look at the term structure for a stock, you will see a “spike” in one of the expirations.
You may be left wondering what could this be? Well, as the title of this section would suggest, spikes in implied volatility across the term structure are usually caused by an event of some sort!
Think about it like this. If there is an earnings event happening 20 days from now, the 10 DTE options are not impacted by it because by the time they expire the event will not yet have occurred.
But the 30 Day options will still have time remaining on them when the event occurs, so the movement caused by the event will impact these options!
In situations like this, here is what the term structure might look like:
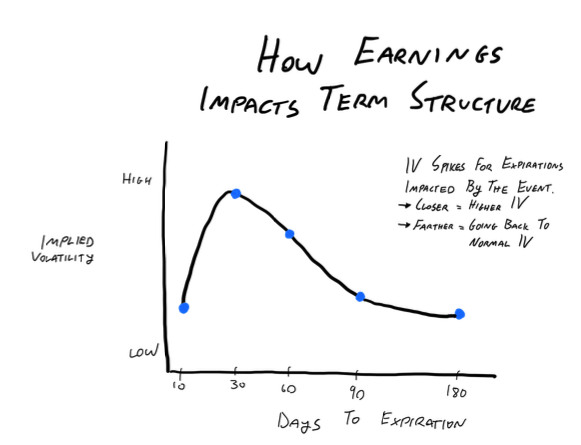
As you can see, the implied volatility for the expiration that does not see the earnings event is lower than the expiration that follows, which will have the most exposure to the event. Then as we start to go further out in time, the implied volatility begins to come back down because even though these longer dated expirations see the earnings event, the impact of it is diluted because there are so many non event days priced into the expiration too. The logic behind this “dilution” is covered in our article about volatility as synthetic time.
Here is an example of how big of an impact an earnings event happening this week can have on the term structure for a ticker.
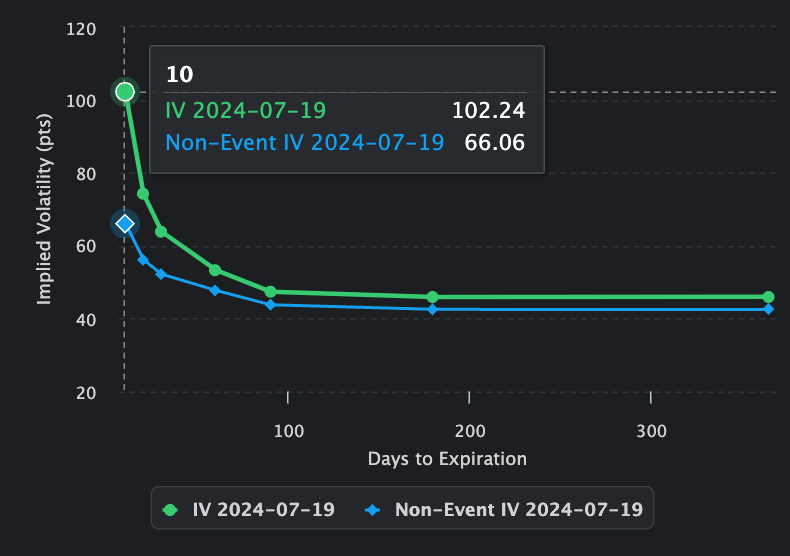
The above graph plots two term structures. One that is the “normal” term structure, and another one that is called the “non-event” term structure, which removes the impact on the implied volatility that is caused by the earnings event.
As you can see, for the closer dated expiration, almost 35% of the implied volatility is entirely due to the earnings event, this is why the difference between the green and blue data points are so large for the 10 DTE options.
But as we go further out in time, you can see how the discrepancy begins to diminish, because as the DTE is increased (post-event expirations) they are less impacted by the event, and as such the difference between event and non-event volatility is minimal.
How understanding the term structure impacts your trading strategies
The term structure always plays a role in your trading strategies because a big part of the structure that you choose to actually place a trade with is the days-to-expiration that you actually select.
If you are trying to trade implied vs realized volatility, you want to be trading the shorter DTE expirations.
If you are trying to trade a change in the level of implied volatility, you will want t be trading the longer DTE expiration.
And regardless of which one you pick, you will want to be aware of what the markets view about the current level of implied volatility is and you will also want to know if there are any upcoming earnings events or other “volatility driving” events that the expiration you are trading may be exposed to.
There is also a third trading insight that can be made immediately available from the term structure, and this is for strategies that involve trading calendar spreads. In these strategies, We wrote an in depth blog about calendar spreads which you can find here.
Conclusion
The term structure is an important part of the volatility surface and can tell us a lot about the volatility that is expected for a stock. Now that you know all the theory behind how it works and what it looks like, the next step is to go out into the market and start looking at the term structure for the tickers you are interested in. See if you can identify what the shape of the term structure is trying to tell you for the stock you are trading. See if you can identify when the market is implying the next earnings event to be.
Test your knowledge and see if you have really understood these concepts, because they will be extremely valuable for you over the course of your option selling career.
Happy trading!