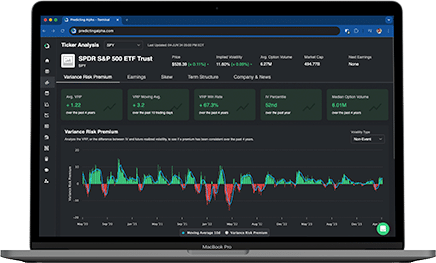
Variance risk premiums often arise around market events that could lead to significant price changes in stocks. Examples include earnings reports, FOMC meetings, and product releases.
These events can trigger substantial price movements, offering considerable returns to those providing liquidity to option buyers during these times.
One of the most popular event-driven trades among Predicting Alpha members is earnings trading. This strategy capitalizes on the increased volatility and potential price swings associated with earnings announcements, providing opportunities for traders to profit from their volatility forecasts.
Key Points
- There is a Huge Risk Premium For Sellers: The variance risk premium around earnings is huge, if you can handle the variance, you can get paid.
- Effective Diversification: Earnings is unique in that you can take my uncorrelated bets. Trade many events in small size and you can make pretty consistent returns each quarter.
- Executing Earnings Trades: Earnings trading has some pretty clear rules to monetize effectively. Enter at close, exit in morning, trade a short dated straddle, and get good fills.
I love this strategy. You will too. Let’s talk about it.
Why Are Earnings Events Popular to Trade?
They Are a Major Source of Volatility (And Premium)
Earnings events are highly volatile, accounting for 30-70% of a stock’s annual movement. During these events, companies disclose critical information about their performance, growth, and any significant challenges they are encountering. This influx of information causes prices to change quickly, making it attractive for people looking for a gamble, but also important for people looking to hedge away risk.
Everyone Wants to Buy Options, No One Wants to Sell
During earnings periods, many market participants are eager to buy options. Funds seek to hedge their positions, while retail traders often look to speculate. Everyone is looking to buy options for one reason or another.
On the other side, no one really seems to want to sell options. This creates a massive supply/demand imbalance, driving up premiums. The reluctancy to sell makes sense given how much volatility there can be around any particular event. If you look at each earnings event in a vacuum, the risk far outweighs the reward. But this is why we don’t just look at one trade when considering this strategy (read the next section and it’ll make sense).
Effective Diversification by Trading Multiple Events
Trading a single earnings event is scary due to the potential for large price movements. That’s why a big reason this strategy is attractive for option sellers is because you can trade many uncorrelated events. Just because Apple has a big move on earnings, doesn’t mean that Walmart will. We can trade hundreds of events, each uncorrelated to the other.
We can effectively diversify our risk by reducing the size of each trade and spreading our trades across many events. For instance, some traders place over 100 trades each earnings season. This allows us to maximize our expected value for the strategy.
Earnings Strategy Overview
What do we do?
We sell straddles on a basket of stocks that have earnings events happening between market close today and market open tomorrow.
We make money when:
The implied move due to earnings is higher than the realized move that actually happens after the numbers come out.
We lose money when:
There is a big surprise and the stock jumps a lot more than the market thought it would.
The strategy is profitable because:
We are able to take dozens of uncorrelated trades every earnings season, minimizing the impact of losing trades and allow us to extract the average premium across the tickers we trade.
A car insurance analogy to help it all make sense
Earnings trading is a lot like selling insurance on cars. On any individual car, you collect what seems like a small amount of premium on a regular basis. Once in a while, a car crashes and you have to pay out a large sum.
The real magic in selling car insurance is that there are millions of cars you can insure, each with different drives and uncorrelated risk, so you can diversify your book by simply increasing the volume of cars you insure.
Earnings are exactly the same. We know that there is a premium embedded into options around earnings events. We also know that stock price changes due to earnings events are uncorrelated. This allows us to place bets across the board for companies that have earnings today and make money by collecting the “average” of their premiums over a large number of trades.
This is the core of how the earnings risk premium operates. It’s a strategy that has been around for a long time and is the foundation of the success experienced by many great traders. Just like we did with the ETF VRP strategy, let’s go step by step through everything you need to know to run this strategy systematically.
3 Steps To Running A Profitable Earnings Strategy
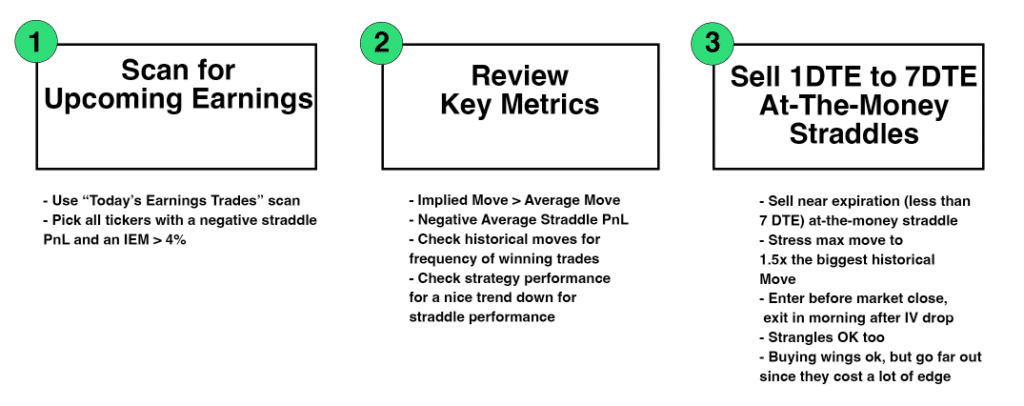
Step 1: Scan for Today’s Earnings Trades
Like all our strategies, success starts with finding good candidates. To make this easy we built a scanner for Predicting Alpha members that identifies tickers with earnings events that are tradable today. Here’s how to do it:
- Go to the Scanner Page: Navigate to the scanner section on Predicting Alpha.
- Select the “Today’s Earnings” Scanner: Choose the scanner that filters for earnings events occurring today.
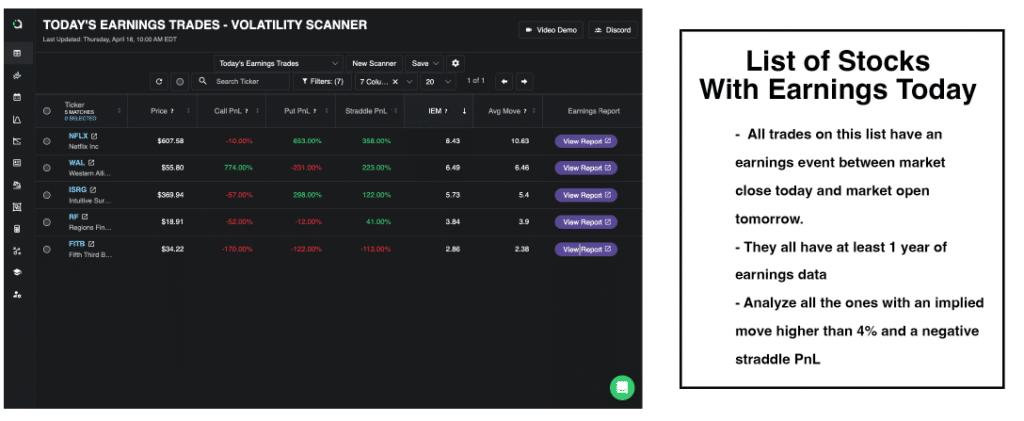
It’ll also show you some of the important backtest metrics right away so you can get a picture of the event before diving deeper. You can customize the scanner too, but we will save those details for another time.
If you are not becoming a Predicting Alpha member any time soon, you can use some of the free earnings calendar tools to find a list of potential trades too!
Filtering and Selecting Earnings Trades
When you pull up the list of earnings events, there are going to be days where there are dozens of potential trades you can take. Since we don’t have unlimited money, we will need a way to narrow down the list of potential trades. To do this, we focus on a couple of key metrics:
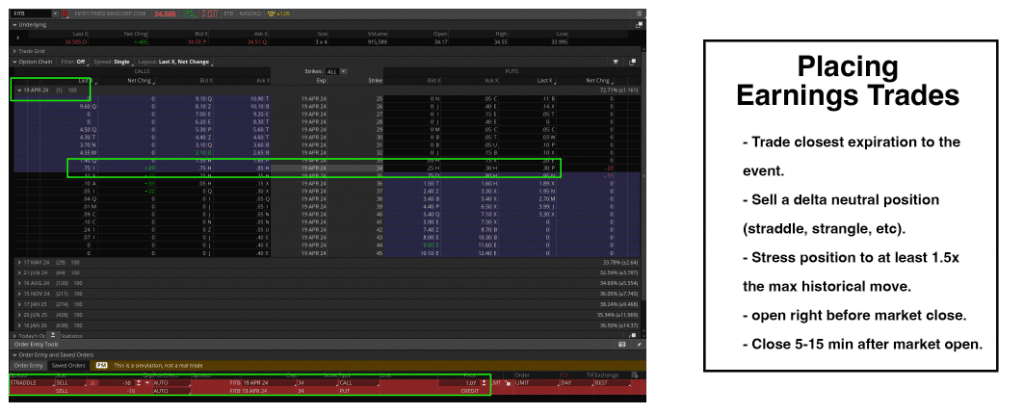
- Straddle PnL: Look for trades where the straddle PnL is negative. This suggests that selling options over historical earnings events for the ticker has been profitable.
- Implied Earnings Move (IEM): Compare the IEM to the average move. If the IEM is higher, it indicates a potential risk premium.
- Price of Underlying Stock: Depending on your account size, you may want to trade tickers with a smaller price per share. Remember: it’s important that we are able to trade lots of tickers in small size. If the share price is too high, a single trade may represent too big of a percent of your account. Its betters to trade many smaller tickers rather than one big ticker.
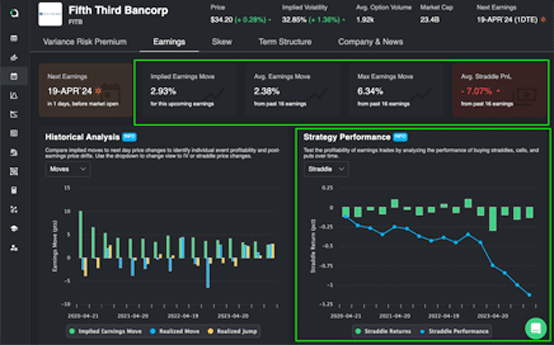
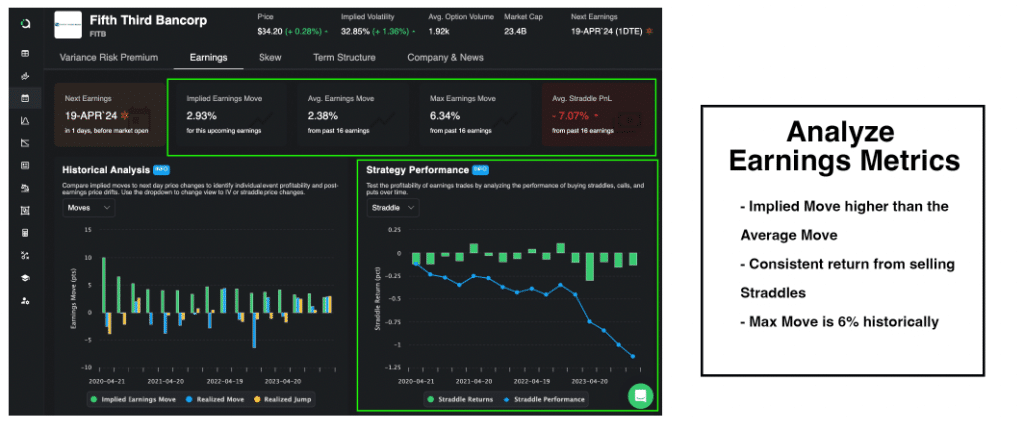
Using the screenshot as an example, FITB appears to be an attractive trade based on these criteria.
Next, we move on to step 2: reviewing the key metrics for the trades we are considering. This involves a deeper analysis to confirm their viability and ensure they align with our strategy.
Step 2: Conduct A Deeper Analysis Into Each Earnings Event
Within the Predicting Alpha platform we built an entire dashboard just for earnings events. It’s got everything you could want to analyze the event from every angle. Most of the value that you need can be derived from a couple key analysis though. So that is what we are going to focus on in this article.
Reviewing Key Metrics for Selected Trades
The main metrics that we focus on are all derived from the backtest that we run for every ticker based on how trading volatility around their earnings events historically has performed. We look at up to four years of earnings events (less if it’s a newer company) and owe use this to try and establish if there is a risk premium that we can capture.
A quick review of FITB tells us it’s a promising trade. Here are the key points:
- Consistent Premium: By looking at the backtest graph, we can see that the straddle is consistently decreasing in value after the earnings event. This can be seen by looking at how the line is sloping downwards.
- Implied Move vs. Average Move: Looking at the key metrics on the dashboard we can see how the implied move is higher than the average move. This powerful metric basically says “the amount that the market thinks the stock will move on earnings is higher than how much it typically moves on earnings.
- Low Maximum Historical Move: The maximum historical move is quite low, indicating that potential losses, if the trade goes against us, will likely be manageable.
Based on these metrics, FITB looks like a strong candidate for an earnings trade. This would likely be one of the trades that we would take as a part of the basket of earnings trades that we would take on this day. We would say that this trade aligns with our strategy, and that there is likely a risk premium that we can monetize.
A similar analysis should be conducted for each trade we consider today. The core question we aim to answer is: “Is there a risk premium for us to collect here?” If the answer is yes, we should proceed with the trade.
We don’t need to delve much deeper into each individual trade. By taking a large number of trades during each earnings season, any variance we experience should balance out, which is a crucial aspect of running this strategy successfully.
Step 3: Execute and Manage Trades
Once we have our final list of trades, it’s time to execute. Lets go over how you actually do this.
The quick answer:
- Sell an at-the-money straddle on the closest expiration date
- Open your trade right before market close (before the event)
- Close your trade 5-10 min after market open (after the event)
The most important thing to remember is that the trade structure we pick is literally just the tool we use to express our view on a ticker.
Need to tighten a screw? Use a screwdriver. Need to cut a piece of wood? Use a saw.
Picking a trade structure is no different.
So what job are we trying to complete with the Earnings Premium strategy? What view are we trying to express? Let’s go through a couple of questions to figure it out.
Do we have a view on…
- If the stock goes up or down? No, we don’t know/care which direction it goes.
- If the stock moves more or less than implied? Yes, we think it will move less.
- If implied volatility goes up or down? Yes we think it will move down.
- What is our time horizon for the trade? Less than 1 day.
Based on these answers, we know that we want a structure that has the following characteristics
- Delta neutral (no PnL impact from direction)
- Long theta (make money as time passes)
- Short gamma (lose money if big moves)
- Short vega (make money if IV crushes)
- Maximum exposure to tomorrow’s outcome
The structure that is the best fit for the job we are looking to accomplish is a short at-the-money straddle with a close expiration date.
Important Decisions When Picking A Trade Structure
Straddles VS Strangles – Which to Trade?
Both straddles and strangles fit the “structure profile” we are looking for with this strategy. When we talked about the ETF VRP strategy, I shared with you my reasoning for why I think strangles are the optimal structure especially for retail traders.
But for earnings, I will actually be sharing why straddles are the superior structure.
The logic is simple.
Since we don’t have a need to delta hedge because of our short time horizon, there is less added benefit to trading strangles.
Trading the straddle allows us to receive better feedback on if our view that implied volatility should be higher than realized volatility is making us money. This works because the straddle price is equal to the implied move, with no added buffer from the wider strikes.
So even though the strangle gives us wider break-evens, it doesn’t actually impact our long term EV in any way and it actually makes it harder for us to get feedback when running the strategy about if what we are seeing is in line with what we should expect and if we are doing a good job with our trade execution (mistakes are more obvious).
Why do we want to trade a close expiration?
We want to trade the closest to 1 DTE expiration available on the option chain. The logic behind this is the same as the reason why we open before the market closes the day before the event and close out in the morning after the event.
We only have a view on the earnings event and want to isolate our exposure to it.
By trading a shorter DTE, the option price is less influenced by the “non earnings event” days.
Think about it. If earnings are tomorrow and the option has 1 day to expiration, it expires very shortly after the event, meaning that the event plays a big role in the value of the option.
But if the option we trade has 1 year to expiration, all of a sudden there are hundreds of “regular days” that dilute the impact of the earnings event on this option. There is just not enough exposure to the difference between the implied and realized move for us to see a meaningful PnL.
So that’s why the shorter the DTE, the better for this strategy.
Why don’t we buy wings or “protection”? Are there better ways to hedge our risk?
At Predicting Alpha we are not a fan of buying wings, especially around earnings. Our core reason is quite simple:
We get paid for holding the risk of a big move happening. If we hedge away the risk of a big move happening for ourselves, why are we getting paid?
Remember: We get paid for providing a service to the market. If we no longer offer the service, we no longer get paid.
“But Sean, what about if the stock moves a crazy amount?”
Well, there are a couple things I have to say about that.
First of all, you will take a big hit. That is the nature of being short volatility and we need to embrace the fact that we will inevitably experience situations like that sometimes. Once again, it’s the reason we are getting paid.
Secondly, the way that you should be hedging your risk is actually through diversification. Remember, the beauty with earnings trading is that you are able to trade literally hundreds of events each season, which means:
- We can spread our risk across a lot of bets
- We are not counting on one trade to make or break our PnL.
If one big loser takes you out of the game, you either sized up way too much or you are trading a ticker that is way too big for your account size.
Rules For Executing The Strategy Like A Pro
Our strategy is based on trading the earnings event, and the earnings event exclusively.
This means that every detail of our trade and execution aims to isolate the earnings event and trade the difference between the implied and realized move.
We already covered the structure we are going to trade in depth. In this section we will cover how to execute and manage this trade flawlessly.
The core rules for managing and executing earnings trades:
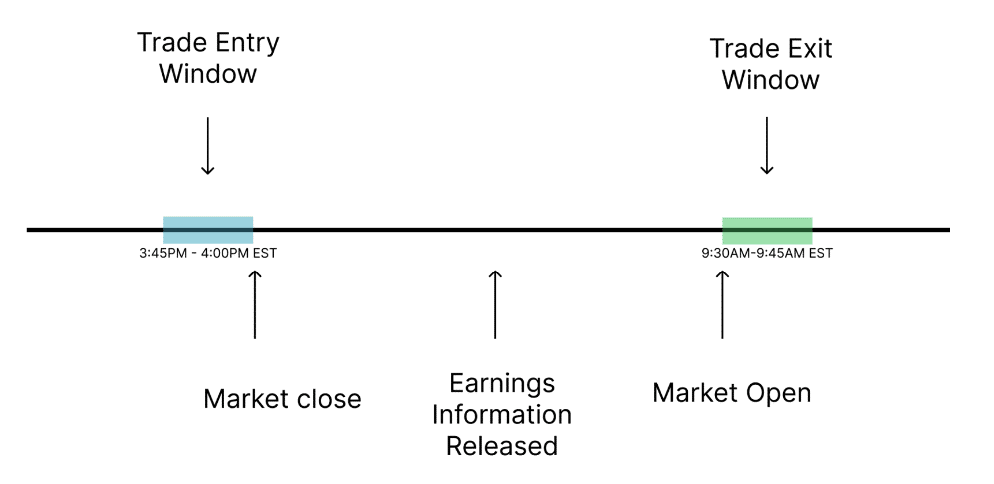
- Trade tight to the event: Open the trades right before the market closes. Exit the trades shortly after the market opens the following day.
- Get good fills: Do not rush. Do not just hit the bid or the ask. Work your orders, and get good fills.
- Time your exit correctly: If the stock moves less than implied or just slightly higher, wait for the implied volatility to crush before closing. If the move is much higher than implied, exit immediately
Rule 1: Trade tight to the event.
Why do we wait until just before the market close to open trades?
The reason that we are waiting until right before the market closes to open up our trades is because everything that happens around the earnings event is not the earnings event.
“I want to only trade the earnings event, so what is the easiest way to make sure that I don’t have exposure to other stuff?”
One answer would be to open the trade right before the event takes place. So this is literally what we do!
Why do we close out the trade the morning after the earnings event?
The reason we close out right in the morning after earnings is for the same reason we open the trade right before the close the day before the event.
We only have a view on the event. So win or lose, we get out when the event is over.
Loss aversion trap: Sometimes, usually if it’s a losing trade I’ll see traders hold the position the day after the earnings event and hope (or in the worst case they convince themselves this actually works) that the stock will go back into the body of the position they sold.
This is a fatal flaw. We have to remember that the degree of control we have over any individual scenario is basically zero. Boring, simple strategies are what we know works. So we stick to that. If we are too attached to the outcome of a single trade, we haven’t been placing enough trades and we have way too much riding on this singular outcome. This is why we chat about our trades in the community. To call each other on our BS and avoid getting in our own way.
Rule 2: Get good fills.
Just like with every strategy, good earnings traders are conscious of the costs they pay.
The most important consideration with earnings trading is the liquidity in the morning. Before market close, the bid/ask spread should be pretty tight. Just follow your normal procedure for getting a fill (start at the ask, and work your order down).
But in the morning, the spread may not be as tight. Think about it. So much new information just entered the market. Market makers aren’t going to immediately know what the fair value is, and this means they may establish a wider bid/ask than usual as they wait for other trader’s orders to help them establish a better spread.
This means that if you are too panicked in the morning, you run the risk of getting bad fills. Bad fills are the most common way that traders destroy a great edge. So we need to be cautious of this.
The easiest way to handle this is to take a deep breath and wait. If the spreads are wide, just do nothing. See if they begin to tighten after a few minutes.
For reference, most of my trades are closed out between 5 and 20 minutes after the market opens.
Rule 3: Time your exit correctly
“I notice that right in the morning, the stock jumps, but the implied volatility has not come down which means that the implied move of the earnings event is still baked into the option!”
Should I be waiting for that implied volatility to come down, or should I just be closing out the trade right away?
What it really comes down to is what exposures do we have in the morning.
Let’s do an example to understand this.
Managing Your Trade Exit For Earnings – Example
ABC stock has an earnings event.
- The implied move is 10%
- We sell an at the money straddle
In the morning, a few different scenarios could unfold.
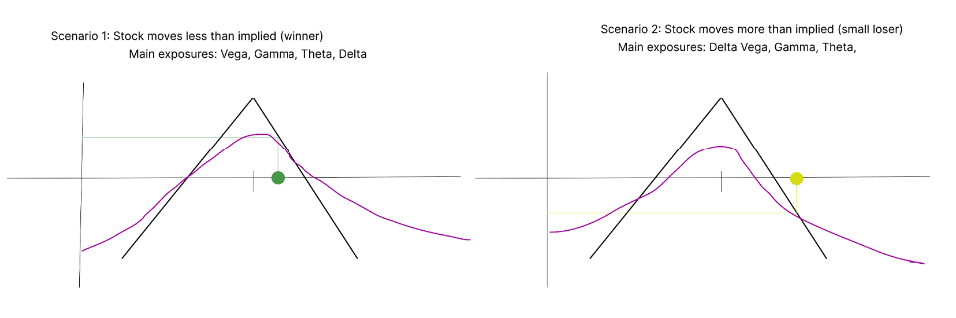
- Scenario 1: realized move is less than implied move (winner)
- Scenario 2: realized move is close to/slightly greater than implied move (small loser)
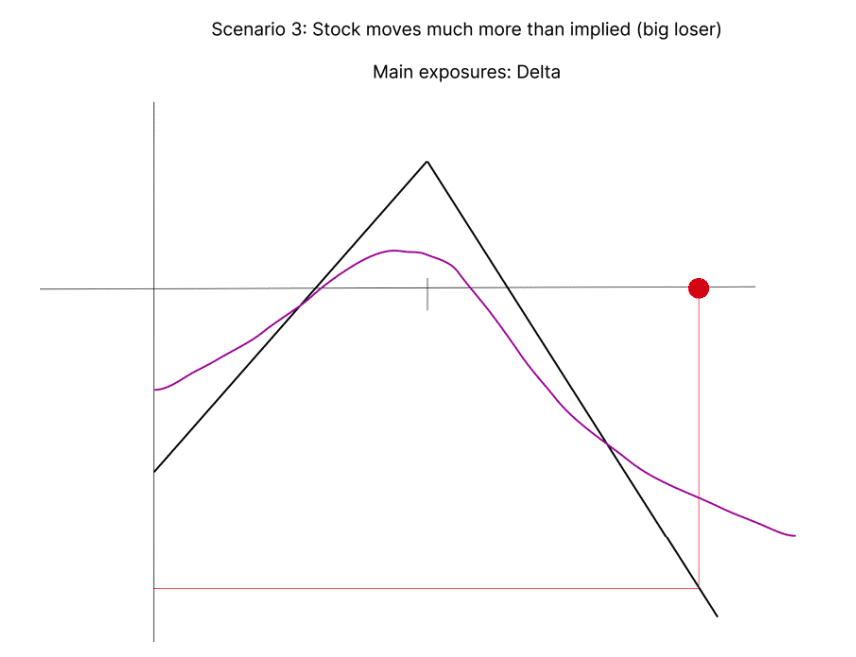
- Scenario 3: realized move is much greater than implied move (big loser)
In each of these scenarios, we still have similar exposures.
- We make money as time passes and if implied volatility comes down.
- We lose money if there are bigger than expected moves or if implied volatility goes up.
But what changes in each of these scenarios is our sensitivity to each of these exposures.
The reason that we want the implied volatility to come down is because there should be a big drop now that the event is over (all the volatility from the earnings event that was being priced in is gone).
We care about this because if we have a lot of Vega, then our PnL can improve significantly from this drop.
In Scenarios 1 & 2, we still have lots of vega exposure and so in these cases, rather than closing out as soon as liquidity makes it possible, we actually want to hold just a bit longer until the implied volatility comes down.
But in Scenario 3, we want to get out of the trade right away. When the stock has a massive move, even if the implied volatility hasn’t come down, we are now so far out of the money that we have very little vega exposure. Meaning that relative to the losses on the position (and the impact on our trade from our delta exposure), the change we would wait for in implied volatility is basically meaningless.
If the realized move is less than or slightly more than implied, wait for IV to crush.
If the realized move is much higher than implied, just get out of the trade.
How do I know how much the implied volatility is supposed to crush?
Good questions! Calculating this is actually pretty complicated, but once again, it’s handled for you in the PA Terminal.
This data point is shown to you on the scanner for each ticker that has earnings today, and if you wanted to see the drop for yourself you can go to the term structure page on the dashboard, adjust the term structure chart to show the event VS non-event term structures, and see the spread between the two for the short dated expirations.
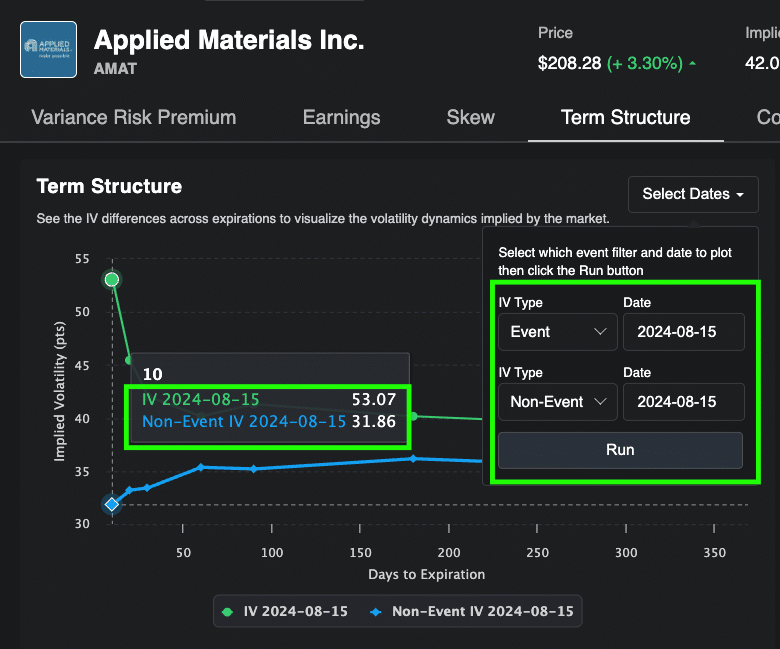
You can use this to estimate how much IV should decrease. Using the example in the image above, if the implied volatility is 53%, and is expected to go to ~ 32% after the event, then the crush we should expect to see is 21%.
If the IV has crushed for the most part, let’s say it’s down from 53% to 35%, you don’t need to be waiting for the last couple of points to get out. Just use this as a benchmark for what to expect and if you see an IV crush in the ballpark of what we forecasted it to be, you can close out with confidence.
Conclusion
This earnings strategy is an excellent method for harvesting the variance risk premium. Once you have this strategy up and running, you’ll gain a clear understanding of how to trade events. With this knowledge, you can start exploring and executing other event-driven trades. For example, you can sell volatility around FOMC events or any other occurrences where you believe there may be a risk premium to capitalize on.