This guide is intended for professional traders aiming to master calendar spreads. By grasping the concepts detailed below, you’ll be able to discover some truly exciting trades.
Be forewarned, this content is challenging.
Calendar spreads are intricate financial structures.
Many traders lack a deep understanding of calendar spreads’ dynamics. Consequently, it’s uncommon to find retail traders executing them correctly. This guide aims to change that and increase the number of traders who can successfully trade calendar spreads.
Important:
I firmly believe that there is significant potential in the trading strategies discussed here. Not many traders delve deeply into these concepts.
For those willing to invest time in identifying mispriced forward volatility, there are certainly substantial opportunities to be found.
Calendar Spread Definition
A calendar spread is an options trading strategy where you buy and sell the same strike option across two different expiration dates.
In this guide, we will concentrate on long calendar spreads.
A long calendar spread involves selling the option with the closer expiration date and buying the option with the later expiration date. For instance, a long calendar spread example would be selling an AAPL July 150 strike call and buying a September 150 strike call.
Conversely, a short calendar spread involves buying the front-month option and selling the back-month option.
Here is an example of what a basic long calendar spread looks like:
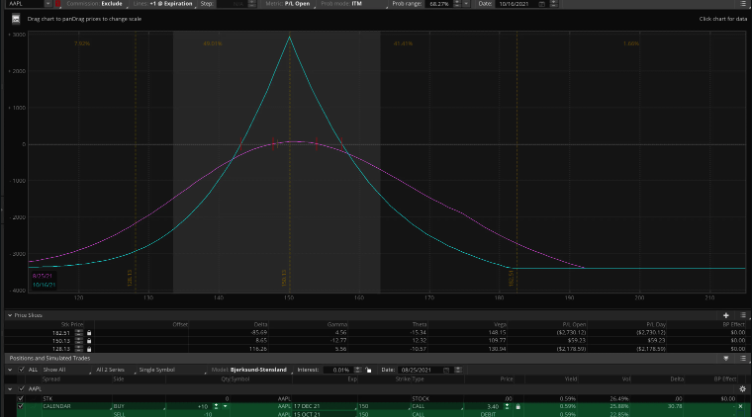
When you trade a long calendar spread, it is a debit position so the maximum amount you can lose is the amount that you paid. In the example above, the maximum loss is $3.40, or $340/lot.
What View Does A Calendar Express On The Market (Greeks/Exposures)
Successful trading hinges on having a clear market outlook and effectively expressing that perspective through your trades.
If your market view is accurate and you articulate it correctly through your trades, you will profit. Conversely, an incorrect market outlook or poor expression of a correct outlook will lead to losses.
Therefore, it is crucial to start by understanding how a calendar spread’s profit and loss (PnL) will react in various market scenarios. This involves analyzing the Greeks and exposures associated with the structure.
Initial Exposures of an ATM Calendar Spread:
- Delta Neutral: At the inception of the trade, we are indifferent to the stock’s price direction.
- Short Gamma: Rapid price movements can negatively impact our position.
- Long Theta: All else being equal, the passage of time will generate profit for us.
- Long Vega*: An increase in implied volatility will benefit our position.
*Traders will often assume that this position is long vega. This is a common mistake that we will break down in a little bit.
Summary:
At first glance, a calendar spread appears to be profitable if the market remains stable or if there is a significant increase in implied volatility.
Also at first glance, it appears likely to incur losses if the stock experiences a sharp movement in its share price.
A Bet on Forward Volatility: Understanding the Calendar Spread
This is where many traders get confused.
A calendar spread is essentially a relative value trade between gamma and vega.
Think of it as “I’m short gamma and hedging with vega.”
Alternatively, it can be viewed as a bet on “forward volatility.”
But what exactly is forward volatility?
Example of Forward Volatility (Concept Breakdown)
Consider this scenario:
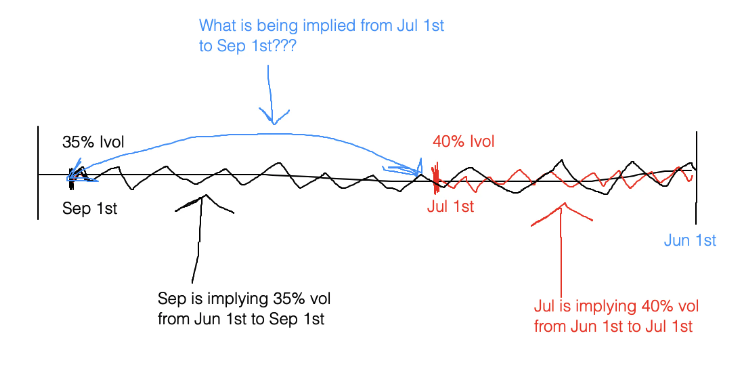
Today is June 1st, and the implied volatilities are as follows:
- July 1st Expiration: 40%
- September 1st Expiration: 35%
What conclusions can we draw from these implied volatilities?
We understand that over the next 30 days, until the July 1st expiration, the market is implying a 40% volatility. Similarly, over the next 90 days, until the September 1st expiration, the market is implying a 35% volatility.
I won’t delve into the math here, but you can easily find the forward volatility formula online. It’s also something calculated for you in the Predicting Alpha Terminal. In this example, the 30/90 forward volatility would be 32%.
When trading a calendar spread, you are essentially expressing a view on forward volatility. If you bought this calendar spread, you would be purchasing forward volatility at 32%.
Calendars as a Relative Value Play
It’s crucial to start thinking of a calendar spread as a relative value play between gamma and vega.
This next concept might be tricky, but it’s essential to fully understand.
When trading the July/September Calendar, the July expiration will have significantly more gamma than the September expiration. Conversely, the September expiration will have more vega.
We sold July options at a 40% implied volatility and bought September options at a 35% implied volatility, thereby locking in a 32% forward volatility.
Now, imagine that over the next 30 days, the realized volatility is 40%.
This scenario would imply a break-even point for our July expiration.
The Tricky Question: What Will September Be Trading At?
Here’s the challenging question: what will the September implied volatility be?
If the September expiration is trading higher than 32%, we will have profited from the calendar spread. If it is trading below 32%, we will have incurred a loss.
Now, let’s explore different scenarios:
If the realized volatility over the next 30 days is 60%, we will have lost on the July expiration since we sold at a 40% volatility level. However, the September expiration should be trading at a much higher volatility, correct?
A significant portion of the PnL for July comes from gamma, whereas most of the PnL for September comes from vega.
One More Example:
Let’s consider another scenario:
Imagine the realized volatility over the next 30 days is 10%.
In this case, we will profit significantly on our July expiration since we sold at a 40% volatility and realized only 10% volatility.
But what about the September expiration?
If we are only realizing 10% volatility, the implied volatility for September will decrease substantially.
Therefore, in this example, we made money on our gamma leg and lost money on our vega leg.
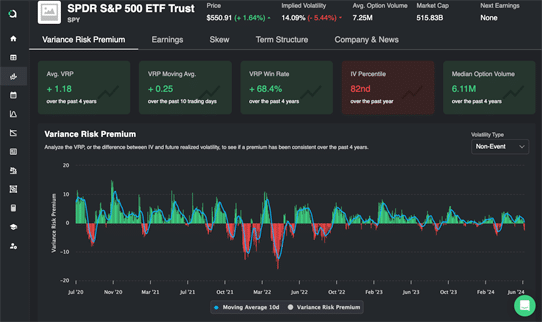
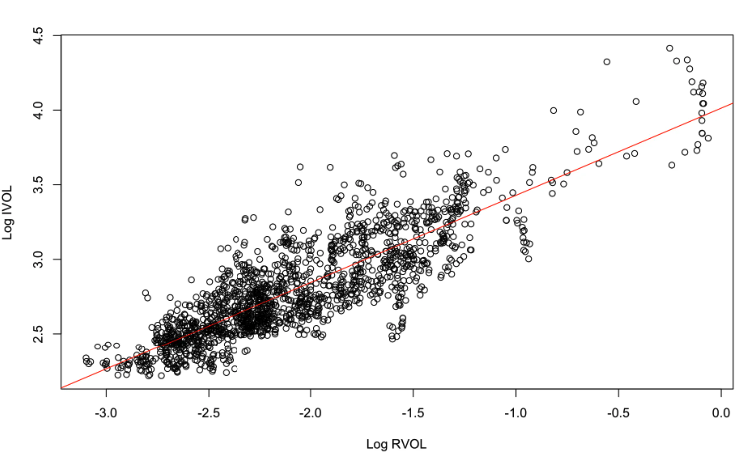
The graph below illustrates the relationship between implied volatility (IVOL) and realized volatility (RVOL) for the QQQ.
This strong correlation indicates that it is uncommon to lose money on both the gamma and vega legs or to profit from both.
When RVOL is high, IVOL tends to be high as well, and vice versa. Instead, you are trading the relative value or “richness” of one leg compared to the other.
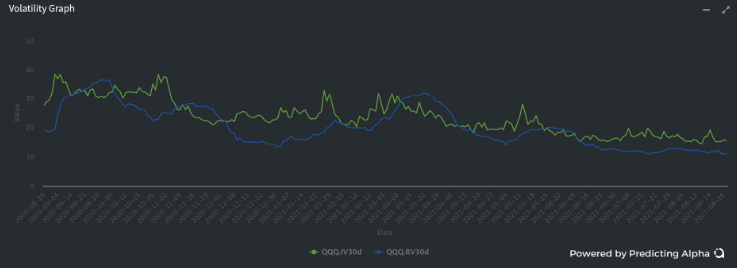
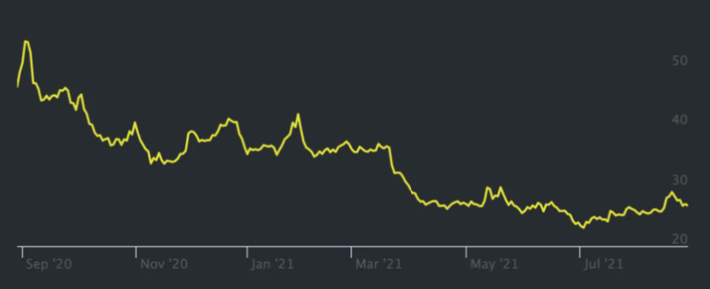
Here is a timeseries of the 30DTE/90DTE forward volatility for AAPL so you can see what it looks like over time.
Root Time – Vega Flat and Root Time Flat:
Now that we have covered the basics, things are about to get more complex!
This complexity is why calendars shouldn’t be traded by most traders.
To identify viable trade ideas, we need to understand how the term structure moves.
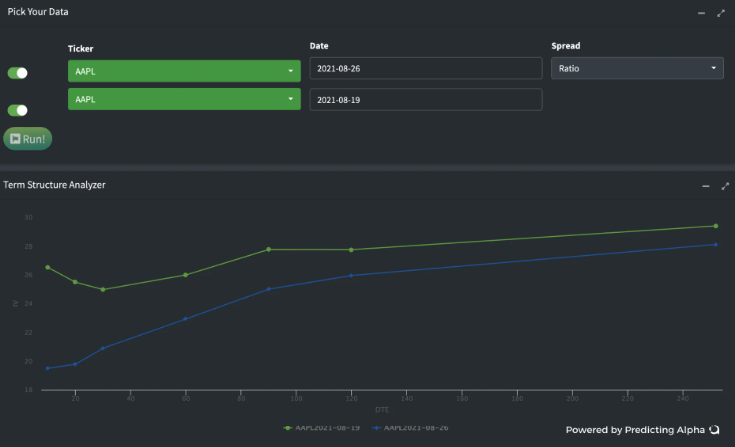
The term structure describes the pattern of implied volatility across different expirations or tenors. Below is an example of AAPL’s term structure on two different days. You can observe that the 30-day options are trading at X%, and the 90-day options are trading at Y%. Additionally, over a one-week period, the volatility across the term structure has decreased.
Understanding the Movement of the Term Structure
It’s crucial to grasp how the term structure “usually” moves, which is typically in a “root time” fashion.
By “root,” we mean the square root.
This will be the only math in this article, I promise.
In essence, this means that short-dated options are more sensitive than longer-dated options. Sensitivity here refers to how much they move in terms of implied volatility.
The Best Way to Explain: An Example
Let’s illustrate this with an example of a flat term structure:
- 30-day IVOL = 30%
- 60-day IVOL = 30%
- 90-day IVOL = 30%
- 120-day IVOL = 30%
- 365-day IVOL = 30%
In this scenario, all the implied volatilities across different expirations are equal at 30%.
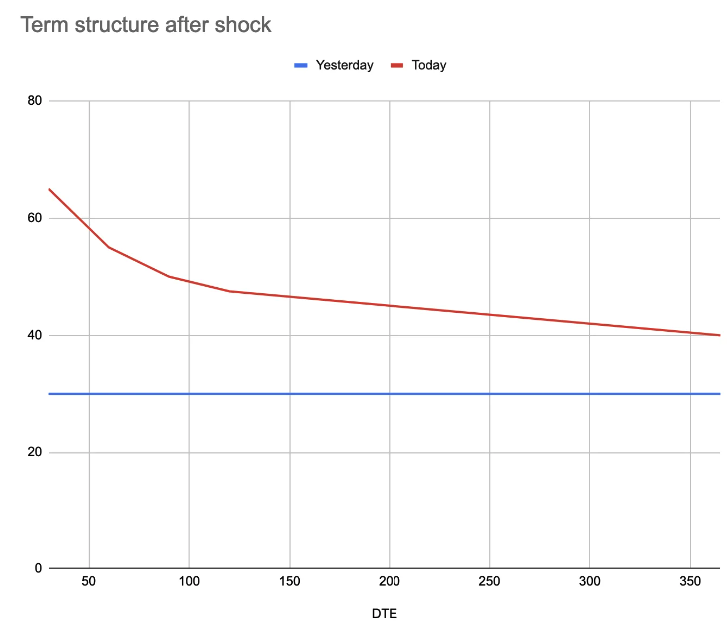
Explaining with an Example: Volatility Shock
Let’s consider a scenario where a significant event occurs, such as China deciding to halt international trade with the USA. This event would likely cause an increase in volatility.
If the 365-day implied volatility (IVOL) jumps 10% to 40%, we need to determine how much the other expirations should change.
The answer lies in the concept of “root time.” Here’s how it works:
A 1-year volatility change of 10 points translates to changes in shorter-term volatilities by the square root of the ratio of days in a year to days until expiration, multiplied by the annualized volatility change.

Here are the calculated multipliers:
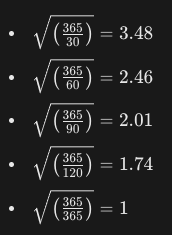
Using these multipliers, the new volatilities are:
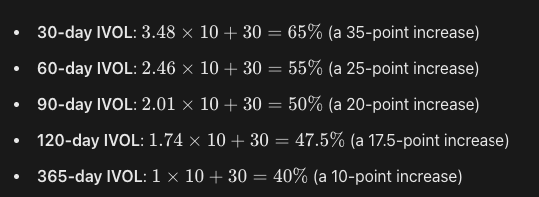
This is what the change in the term structure would look like:
Fading Non-Root Movements and Vega Behavior
Some traders attempt to exploit deviations from root time movements. For instance, if the 90-day IVOL only moved to 45% after the shock, they would buy options with that expiration and sell options with surrounding expirations using a calendar spread.
What’s particularly interesting about trading calendars is that vega also follows a root time pattern through the option chain.
Here are AAPL’s current vega numbers for at-the-money (ATM) call options across different tenors:
- 30-day vega: 17
- 60-day vega: 24
- 90-day vega: 29
- 120-day vega: 34
- 365-day vega: 59
Understanding Vega and PnL Calculation
Vega measures our sensitivity to changes in implied volatility. For example, if an option has a vega of 10 and the implied volatility increases by 1 point (from 30 to 31), the profit would be 1 x 10 (vega exposure) or $10.
Let’s calculate the PnL for our earlier scenario where the 1-year implied volatility increased by 10% from 30% to 40%.
Call PnL=Point increase×Vega\text{Call PnL} = \text{Point increase} \times \text{Vega}Call PnL=Point increase×Vega
Here’s the PnL breakdown for each expiration:
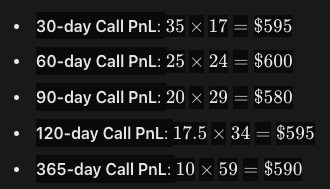
Isn’t that amazing?
Root Time Flat: The Reality of Vega Exposure
Although it initially seemed like our calendar spread was long vega, the shock to volatilities left us with no net gain!
All the call options generated nearly the same amount of money, with slight differences due to rounding errors.
This indicates that our calendar spread is not truly long vega but is instead “root time flat.”
Being root time flat means that if normal volatility movements occur across the term structure, we neither lose nor gain money due to our vega exposure.
Free Alpha: Profiting from Non-Root Movements
If you’ve made it this far, here’s some valuable insight.
You might be wondering, how can we make money on vega using a “root time flat” calendar spread?
The answer is that you will profit or incur losses from non-root movements.
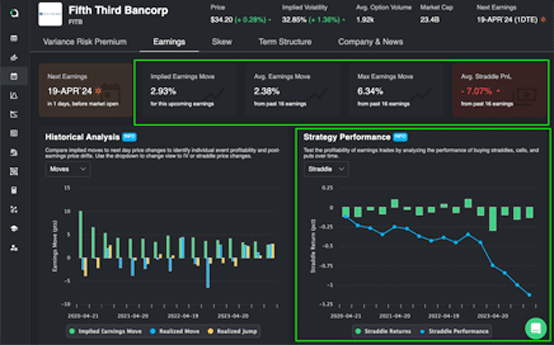
Here’s an example of how to make money: Imagine you receive a tip that a pharmaceutical company will release a new drug on September 1st. Looking at the option chain, you see the following volatility levels:
- July: 30%
- August: 30%
- September: 30%
- October: 30%
Given the anticipated major news release in September, the September contracts should be trading at a higher volatility than the July and August contracts, but they are not!
Capitalizing on Non-Root Movements
To exploit this opportunity, we can sell August volatility and buy September volatility.
When the market finally prices in the drug release, September volatility will increase, allowing us to profit from our calendar spread.
Why does this work? Because a non-root movement has occurred—August volatility remains unchanged while September volatility might increase from 30% to 40%. Since we are long on September volatility, we stand to gain. Revisiting our forward volatility example, we initially bought forward volatility at 30% (August 30% and September 30% = forward volatility of 30%). Now, with the new information, we have a forward volatility that is much higher (August 30% and September 40%).
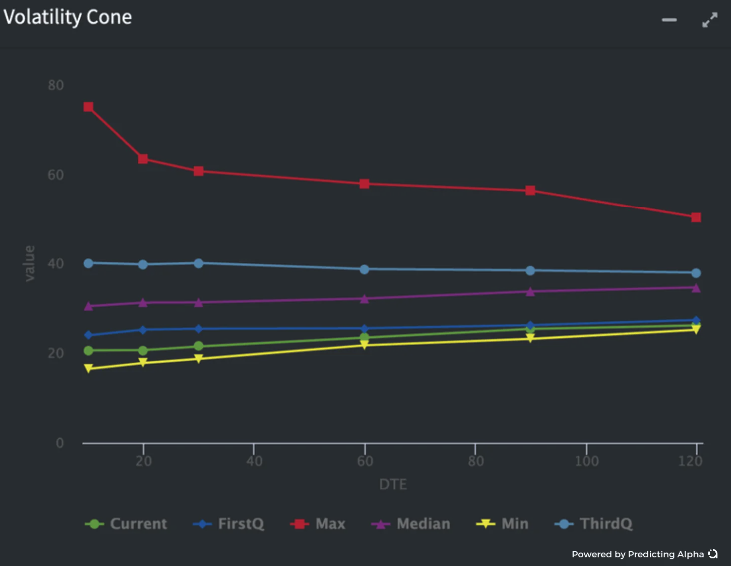
Using a Volatility Cone to Identify Richness or Cheapness
A useful tool for identifying richness or cheapness across the term structure is a “volatility cone.”
A volatility cone shows where implied volatilities have historically been for different tenors, providing insight into whether current volatilities are rich or cheap.
For example, consider the following scenario depicted in the image below: imagine we observe a term structure where the 30-day implied volatility (IV30) is 80% and the 120-day implied volatility (IV120) is also 80%.
Given such a flat term structure at these levels, we might conclude that longer-dated volatilities are overpriced relative to short-term volatilities, especially if the stock is realizing a volatility of around 100%. In this case, we could execute a reverse calendar spread—selling the back month and buying the front month.
This trade expresses the view that gamma is cheap relative to vega.
Final Thoughts
Always remember: Your creativity and idea generation are where alpha will come from. However, your understanding of how options work is what will help you:
a) Identify new areas to explore b) Monetize your ideas effectively
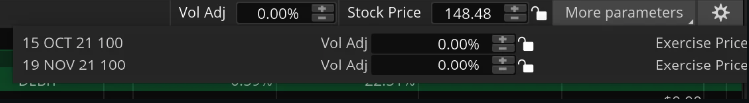
If you want to experiment with calendar spread PnL, head to the Thinkorswim (ToS) “Analyze” tab. In the right corner, you’ll see a small gear icon—click it, then select “More parameters.” You can adjust the volatility levels up and down to observe how your PnL changes.
Conclusion
This has been the most intricate part of the series so far. At the very least, I hope you now appreciate the complexities of volatility over time and the dynamics of calendar spreads.
We had to delve deeply because calendar spreads are inherently complex. However, as mentioned at the outset, once you grasp these dynamics thoroughly, there are some truly exciting trading opportunities.
Inherently, merely knowing this information won’t make you money. However, having a comprehensive understanding of these concepts can be invaluable. I hope you have enjoyed this read and gained some insight into how to trade calendar spreads effectively.